- Page 1 and 2:
Schweitzer-Mauduit International,
- Page 3 and 4:
Buyers Willingness to Switch……
- Page 5 and 6:
Net Sales/Accounts Receivable……
- Page 7:
Enterprise/EBITDA………………
- Page 11 and 12:
Competitive ForceRivalry Among Exis
- Page 13 and 14:
they spend money devoted to R & D.
- Page 15 and 16:
The next part of our financial anal
- Page 17 and 18:
Company OverviewSchweitzer-Mauduit
- Page 19 and 20:
table also shows that SWM’s sales
- Page 21 and 22:
Competitive ForceDegree of Competit
- Page 23 and 24:
The size of the firms in the indust
- Page 25 and 26:
Total Assets 3500 3000 2500 2000 1
- Page 27 and 28:
Excess CapacityExcess capacity aris
- Page 29 and 30:
scale in the industry is vital to a
- Page 31 and 32:
1400 1200 1000 800 600 400 200 0 Pr
- Page 33 and 34:
RelationshipsThe relationships of t
- Page 35 and 36:
its product (indirectly), the threa
- Page 37 and 38:
it is easy for them to dictate the
- Page 39 and 40:
As far as the purpose of tobacco pa
- Page 41 and 42:
Volume per BuyersThe volume a buyer
- Page 43 and 44:
(SWM 10-K). Considering the overall
- Page 45 and 46:
Cost LeadershipCost leadership mean
- Page 47 and 48:
likely for the customer to return a
- Page 49 and 50:
of pride in being the “the world
- Page 51 and 52:
educing product costs. The governme
- Page 53 and 54:
It is evident when reading the tabl
- Page 55 and 56:
The second of the two accounting po
- Page 57 and 58:
SWM for the most part does a suffic
- Page 59 and 60:
Schweitzer-Mauduit and its competit
- Page 61 and 62:
their economic activity. If firms h
- Page 63 and 64:
contracts and, to a lesser extent,
- Page 65 and 66:
The ability to do this gives firms
- Page 67 and 68:
their sales in U.S. dollars to mini
- Page 69 and 70:
Schweitzer Mauduit 2004 2005 2006 2
- Page 71 and 72:
ConclusionThe accounting strategy a
- Page 73 and 74:
Schweitzer-Mauduit2004 2007 2006 20
- Page 75 and 76:
than capitalized. The only reason t
- Page 77 and 78:
5 Δ Sales/Cash from Sales 4 3 2
- Page 79 and 80:
Δ Net Sales/Accounts Receivable
- Page 81 and 82:
Δ Net Sales/Inventory 30 25 20 1
- Page 83 and 84:
0.3 CFFO/OI 0.25 0.2 0.15 0.1 0.05
- Page 85 and 86:
12 CFFO/NOA 10 8 6 4 2 SWM AOI UVV
- Page 87 and 88:
200 Δ Asset Turnover 150 100 50
- Page 89 and 90:
4 Δ Total Accurals/ Sales 2 0 -
- Page 91 and 92:
ConclusionThe ratios examined above
- Page 93:
of a firm’s financials. The firm
- Page 96 and 97:
Restated Income Statement For ye
- Page 98 and 99:
Research and Development Schweitz
- Page 100 and 101: New taxes on Net IncomeIn millions
- Page 102 and 103: Amortized Goodwill
- Page 104 and 105: obligations in the past five years,
- Page 106 and 107: 1.200 Quick Asset Ratio 1.000 0.8
- Page 108 and 109: 2004 2005 2006 2007 2008SWM 25.9881
- Page 110 and 111: comparison. A small ratio shows inv
- Page 112 and 113: 6 Inventory Turnover 5 4 3 2 1 SWM
- Page 114 and 115: 2004 2005 2006 2007 2008SWM 79.5248
- Page 116 and 117: Profitability Ratio AnalysisProfita
- Page 118 and 119: Operating Expense RatioThe operatin
- Page 120 and 121: 15 Operating Pro`it Margin 10 5 0
- Page 122 and 123: Net Profit Margin 2004 2005 2006 20
- Page 124 and 125: Return on AssetsThe return on asset
- Page 126 and 127: 40 Return on Equity 20 0 -20 -40
- Page 128 and 129: Internal Growth Rate 2004 2005 2006
- Page 130 and 131: industry average as much as it did
- Page 132 and 133: Debt/Equity RatioThe debt-to-equity
- Page 134 and 135: Schweitzer-Mauduit is at a low 1.61
- Page 136 and 137: Mauduit has stayed pretty stable th
- Page 138 and 139: it looks to keep declining, meaning
- Page 140: Gross profit is the next step in fo
- Page 143 and 144: Balance Sheet143
- Page 145 and 146: liabilities, we take the already fo
- Page 147 and 148: Statement of Cash FlowsThe statemen
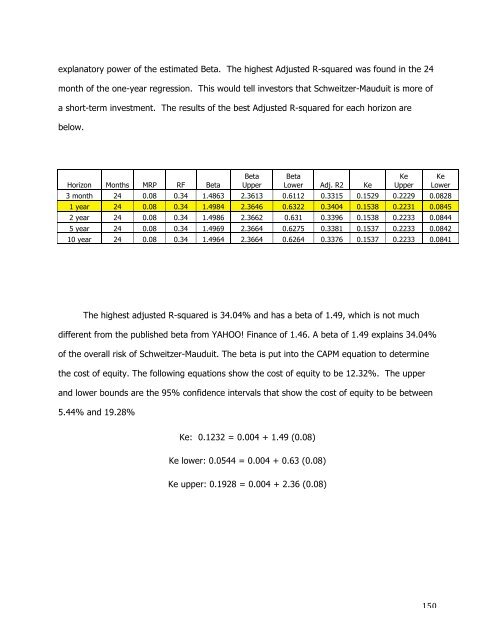
- Page 149: Estimating Cost of CapitalCost of E
- Page 153 and 154: The table below shows the liability
- Page 155 and 156: The cost of capital is the interest
- Page 157 and 158: declared overvalued. Prices falling
- Page 159 and 160: P/E ForecastedCompany PPS EPS P/E F
- Page 161 and 162: Dividends/Price RatioCompany PPS DP
- Page 163 and 164: Price/EBITDACompany Market Cap EBIT
- Page 165 and 166: Price/Free Cash FlowCompany Market
- Page 167 and 168: November 2, 2009 we had to calculat
- Page 169 and 170: Schweitzer-‐Mauduit's Free Ca
- Page 171 and 172: Now that we have calculated the tot
- Page 173 and 174: subtracting the normal earnings for
- Page 175 and 176: Long-Run Residual Income Valuation
- Page 177 and 178: Cost of EquityReturn on Equity-0.14
- Page 179 and 180: Growth RateReturn on Equity-0.14 -0
- Page 181 and 182: Return on Equity RestatedGrowth Rat
- Page 183 and 184: Once the industry analysis had been
- Page 185 and 186: AppendicesSales Manipulation Diagno
- Page 187 and 188: CFFO/ OI Change 2004 2005 2006
- Page 189 and 190: UVV 2.170832 2.687889 2.78523 2
- Page 191 and 192: Capital Structure RatiosDebt to Equ
- Page 193 and 194: 3MonthRatesSUMMARY OUTPUT Regressio
- Page 195 and 196: Coefficients Intercept 0.035115 X
- Page 197 and 198: Total 71 0.987349 Intercept X Vari
- Page 199 and 200: Total 35 0.775347 Intercept X Vari
- Page 201 and 202:
Total 59 1 2 0.939751 Coefficients
- Page 203 and 204:
Total 23 3 5 0.624714 Coefficients
- Page 205 and 206:
Residual Total 46 47 0.624852 0.848
- Page 207 and 208:
Residual Total 70 71 1 1 6 0.7615
- Page 209 and 210:
Residual Total 34 35 0.519917 0.775
- Page 211 and 212:
Price Earnings Growth(P.E.G.)Compan
- Page 213 and 214:
Discounted Free Cash Flowt 0 1 2 3
- Page 215 and 216:
Price(11/1/1988)Initial Costof Equi
- Page 217 and 218:
Figures in Millions (Except per S
- Page 219 and 220:
Growth Rate RestatedReturn on Equit
- Page 221 and 222:
Return on EquityGrowth RateKe -30%
- Page 223 and 224:
Schweitzer-‐Mauduit Restated
- Page 225:
Heakal, Reem. "What Are Economies o