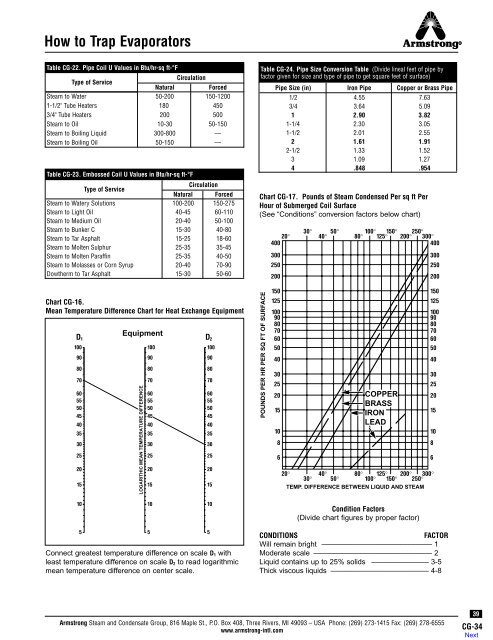
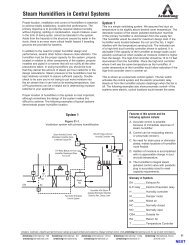
<strong>How</strong> <strong>to</strong> <strong>Trap</strong> Evapora<strong>to</strong>rsTable CG-22. Pipe Coil U Values in Btu/hr-sq ft-°FType of ServiceCirculationNaturalForced<strong>Steam</strong> <strong>to</strong> Water 50-200 150-12001-1/2" Tube Heaters 180 4503/4" Tube Heaters 200 500<strong>Steam</strong> <strong>to</strong> Oil 10-30 50-150<strong>Steam</strong> <strong>to</strong> Boiling Liquid 300-800 —<strong>Steam</strong> <strong>to</strong> Boiling Oil 50-150 —Table CG-23. Embossed Coil U Values in Btu/hr-sq ft-°FType of ServiceCirculationNatural Forced<strong>Steam</strong> <strong>to</strong> Watery Solutions 100-200 150-275<strong>Steam</strong> <strong>to</strong> Light Oil 40-45 60-110<strong>Steam</strong> <strong>to</strong> Medium Oil 20-40 50-100<strong>Steam</strong> <strong>to</strong> Bunker C 15-30 40-80<strong>Steam</strong> <strong>to</strong> Tar Asphalt 15-25 18-60<strong>Steam</strong> <strong>to</strong> Molten Sulphur 25-35 35-45<strong>Steam</strong> <strong>to</strong> Molten Paraffin 25-35 40-50<strong>Steam</strong> <strong>to</strong> Molasses or Corn Syrup 20-40 70-90Dowtherm <strong>to</strong> Tar Asphalt 15-30 50-60Table CG-24. Pipe Size Conversion Table (Divide lineal feet of pipe byfac<strong>to</strong>r given for size and type of pipe <strong>to</strong> get square feet of surface)Pipe Size (in) Iron Pipe Copper or Brass Pipe1/2 4.55 7.633/4 3.64 5.091 2.90 3.821-1/4 2.30 3.051-1/2 2.01 2.552 1.61 1.912-1/2 1.33 1.523 1.09 1.274 .848 .954Chart CG-17. Pounds of <strong>Steam</strong> Condensed Per sq ft PerHour of Submerged Coil Surface(See “Conditions” conversion fac<strong>to</strong>rs below chart)20°40030025020030°40° 50° 80° 100° 125° 150° 250°200° 300°400300250200Chart CG-16.Mean Temperature Difference Chart for Heat Exchange EquipmentEquipmentD 1 D 210090807060555045403530252015LOGARITHIC MEAN TEMPERATURE DIFFERENCE1009080706055504540353025201510090807060555045403530252015POUNDS PER HR PER SQ FT OF SURFACE150125100908070605040302520151086COPPERBRASSIRONLEAD15012510090807060504020° 40° 80° 125° 200° 300°30° 50° 100° 150° 250°TEMP. DIFFERENCE BETWEEN LIQUID AND STEAM302520151086101010Condition Fac<strong>to</strong>rs(Divide chart figures by proper fac<strong>to</strong>r)5Connect greatest temperature difference on scale D 1 withleast temperature difference on scale D 2 <strong>to</strong> read logarithmicmean temperature difference on center scale.55CONDITIONSFACTORWill remain bright ––––––––––––––––––––––––––– 1Moderate scale ––––––––––––––––––––––––––––– 2Liquid contains up <strong>to</strong> 25% solids –––––––––––––– 3-5Thick viscous liquids –––––––––––––––––––––––– 4-8<strong>Armstrong</strong> <strong>Steam</strong> and Condensate Group, 816 Maple St., P.O. Box 408, Three Rivers, MI 49093 – USA Phone: (269) 273-1415 Fax: (269) 278-6555www.armstrong-intl.com39CG-34
<strong>How</strong> <strong>to</strong> <strong>Trap</strong> Jacketed Kettles<strong>Steam</strong> jacketed kettles are essentially steam jacketed cookersor concentra<strong>to</strong>rs. They are found in all parts of the world andin almost every kind of application: meat packing, paper andsugar making, rendering, fruit and vegetable processing andfood preparation—<strong>to</strong> name a few.There are basically two types of steam jacketed kettles—fixed gravity drain and tilting syphon drain. Each typerequires a specialized method for trapping steam, althoughthe major problems involved are common <strong>to</strong> both.The most significant problem encountered is air trapped withinthe steam jacket, which adversely affects the temperature.Jacketed kettles usually perform batch operations, andmaintaining a uniform or “cooking” temperature is critical. Withan excessive amount of air, wide variations in temperatureoccur and may result in burnt product and/or slow production.To be more specific, under certain conditions as little as1/2 of 1% by volume of air in steam can form an insulatingfilm on the heat transfer surface and reduce efficiency asmuch as 50%. See pages CG-7 and CG-8.A second basic concern in the use of steam jacketed kettlesis the need for a steady, thorough removal of condensate.Accumulation of condensate in the jacket leads <strong>to</strong> unreliabletemperature control, reduces the output of the kettle andcauses water hammer.<strong>Trap</strong> Selection for Jacketed KettlesTable CG-25 gives the required trap capacities for varioussize kettles based on the following assumptions:U = 175 Btu/hr-sq ft-°FSafety fac<strong>to</strong>r of 3 included.EXAMPLE: What would be the recommended trap capacityfor a 34" gravity drained kettle at 40 psig steam? Readingdirectly from the chart, a trap with a capacity of 1,704 lbs/hrat the operating pressure is required.For an alternative method of determining condensate, usethe following formula:Q =G x sg x Cp x ∆T x 8.3H x tWhere:Q = Condensate loads (lbs/hr)G = Gallons of liquid <strong>to</strong> be heatedsg = Specific gravity of the liquidCp = Specific heat of the liquid∆T = Temperature rise of the liquid °F8.3 = lbs/gal of waterH = Latent heat of the steam (Btu/lb)t = Time in hours for product heatingEXAMPLE: Select a trap for a 250-gallon kettle using 25 psigsteam <strong>to</strong> heat a product with a specific gravity of 0.98 and aspecific heat of 0.95 Btu/lb-°F. Starting at room temperatureof 70°F, the product will be heated <strong>to</strong> 180°F in 1/2 hour.(Assume 3:1 safety fac<strong>to</strong>r.) Using the formula:Q =250 gal x 0.98 x 0.95 Btu/lb-°F x 110°F x 8.3 lbs/gal933 Btu/lb x 0.5 hr=212,500466.5= 455 lbs/hrNow simply multiply by a safety fac<strong>to</strong>r of 3 <strong>to</strong> get 1,365 lbs/hrof condensate and select the proper type and capacity trap.Based on the standard requirements and problems involvedwith fixed gravity drained kettles, the most efficient type trap<strong>to</strong> use is the inverted bucket.The inverted bucket trap vents air and CO 2 at steam temperatureand provides <strong>to</strong>tal efficiency against back pressure.The primary recommendation for tilting syphon drainedkettles is the au<strong>to</strong>matic differential condensate controller.In addition <strong>to</strong> providing the same features as the IB, the DCoffers excellent air venting ability at very low pressure andexcellent flash steam handling ability. If an IB trap is selectedfor syphon drained service, use a trap one size larger.General Recommendations for Maximum EfficiencyDesirable Cooking Speed. Because the product cookedhas such an important bearing on trap selection, a plantwith many jacketed kettles should conduct experimentsusing different sizes of traps <strong>to</strong> determine the size givingbest results.<strong>Steam</strong> Supply. Use steam lines of ample size <strong>to</strong> supplysteam <strong>to</strong> the kettles. Locate the inlet nozzle high up onthe jacket for best results. It should be slotted so as <strong>to</strong> givesteam flow around the entire jacket area.InstallationInstall traps close <strong>to</strong> the kettle. You can further increasethe dependability and air-handling capability by installinga thermostatic air vent at high points in the jacket. See Figs.CG-50 and CG-51.Never drain two or more kettles with a single trap.Group drainage will invariably result in short circuiting.Chart CG-18. Recommendation Chart(See Page CG-2 for “Feature Code” References.)Equipment Being<strong>Trap</strong>ped1st Choice andFeature CodeAlternate ChoiceJacketed KettlesGravity DrainIBLVB, C, E, H, K, NF&T or ThermostaticJacketed KettlesSyphon DrainDCB, C, E, G, H, K, N, PIBLV40CG-35<strong>Armstrong</strong> <strong>Steam</strong> and Condensate Group, 816 Maple St., P.O. Box 408, Three Rivers, MI 49093 – USA Phone: (269) 273-1415 Fax: (269) 278-6555www.armstrong-intl.com