Annual report 2008/09 - Axpo Group
Annual report 2008/09 - Axpo Group
Annual report 2008/09 - Axpo Group

You also want an ePaper? Increase the reach of your titles
YUMPU automatically turns print PDFs into web optimized ePapers that Google loves.
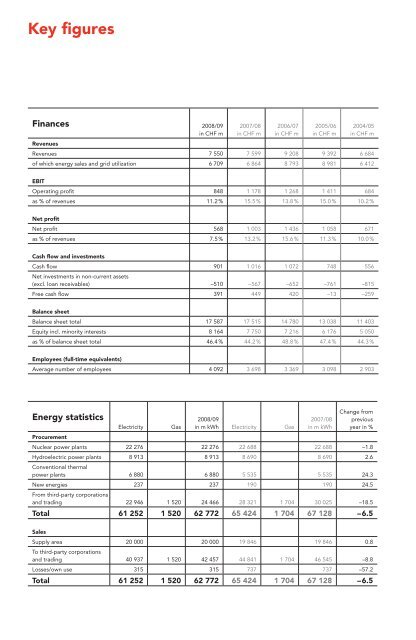
Key fi gures<br />
Finances <strong>2008</strong>/<strong>09</strong><br />
in CHF m<br />
Revenues<br />
2007/08<br />
in CHF m<br />
2006/07<br />
in CHF m<br />
2005/06<br />
in CHF m<br />
2004/05<br />
in CHF m<br />
Revenues 7 550 7 599 9 208 9 392 6 684<br />
of which energy sales and grid utilization 6 7<strong>09</strong> 6 864 8 793 8 981 6 412<br />
EBIT<br />
Operating profi t 848 1 178 1 268 1 411 684<br />
as % of revenues 11.2 % 15.5 % 13.8 % 15.0 % 10.2 %<br />
Net profi t<br />
Net profi t 568 1 003 1 436 1 058 671<br />
as % of revenues 7.5 % 13.2 % 15.6 % 11.3 % 10.0 %<br />
Cash fl ow and investments<br />
Cash fl ow 901 1 016 1 072 748 556<br />
Net investments in non-current assets<br />
(excl. loan receivables) –510 –567 –652 –761 –815<br />
Free cash fl ow 391 449 420 –13 –259<br />
Balance sheet<br />
Balance sheet total 17 587 17 515 14 780 13 038 11 403<br />
Equity incl. minority interests 8 164 7 750 7 216 6 176 5 050<br />
as % of balance sheet total 46.4 % 44.2 % 48.8 % 47.4 % 44.3 %<br />
Employees (full-time equivalents)<br />
Average number of employees 4 <strong>09</strong>2 3 698 3 369 3 <strong>09</strong>8 2 903<br />
Energy statistics<br />
<strong>2008</strong>/<strong>09</strong><br />
in m kWh Electricity Gas<br />
2007/08<br />
in m kWh<br />
Change from<br />
previous<br />
year in %<br />
Electricity Gas<br />
Procurement<br />
Nuclear power plants 22 276 22 276 22 688 22 688 –1.8<br />
Hydroelectric power plants<br />
Conventional thermal<br />
8 913 8 913 8 690 8 690 2.6<br />
power plants 6 880 6 880 5 535 5 535 24.3<br />
New energies<br />
From third-party corporations<br />
237 237 190 190 24.5<br />
and trading 22 946 1 520 24 466 28 321 1 704 30 025 –18.5<br />
Total 61 252 1 520 62 772 65 424 1 704 67 128 –6.5<br />
Sales<br />
Supply area<br />
To third-party corporations<br />
20 000 20 000 19 846 19 846 0.8<br />
and trading 40 937 1 520 42 457 44 841 1 704 46 545 –8.8<br />
Losses/own use 315 315 737 737 –57.2<br />
Total 61 252 1 520 62 772 65 424 1 704 67 128 –6.5