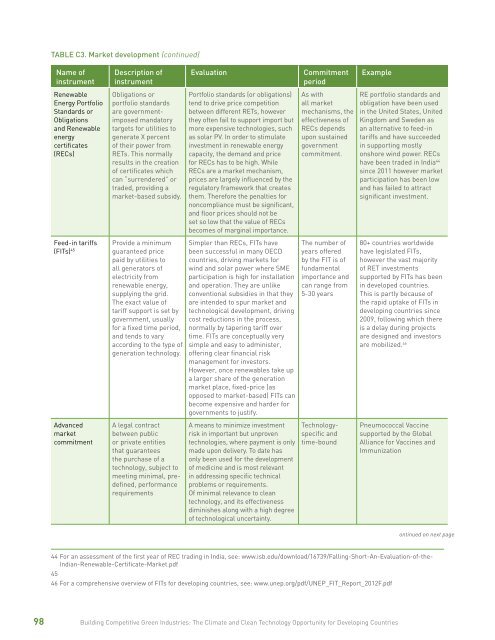
44 45 46TABLE C3. Market development (continued)Name ofinstrumentDescription ofinstrumentEvaluationCommitmentperiodExampleRenewableEnergy PortfolioStandards orObligationsand Renewableenergycertificates(RECs)Obligations orportfolio standardsare governmentimposedmandatorytargets for utilities togenerate X percentof their power fromRETs. This normallyresults in the creationof certificates whichcan “surrendered” ortraded, providing amarket-based subsidy.Portfolio standards (or obligations)tend to drive price competitionbetween different RETs, howeverthey often fail to support import butmore expensive technologies, suchas solar PV. In order to stimulateinvestment in renewable energycapacity, the demand and pricefor RECs has to be high. WhileRECs are a market mechanism,prices are largely influenced by theregulatory framework that createsthem. Therefore the penalties fornoncompliance must be significant,and floor prices should not beset so low that the value of RECsbecomes of marginal importance.As withall marketmechanisms, theeffectiveness ofRECs dependsupon sustainedgovernmentcommitment.RE portfolio standards andobligation have been usedin the United States, UnitedKingdom and Sweden asan alternative to feed-intariffs and have succeededin supporting mostlyonshore wind power. RECshave been traded in India 44since 2011 however marketparticipation has been lowand has failed to attractsignificant investment.Feed-in tariffs(FITs) 45Provide a minimumguaranteed pricepaid by utilities toall generators ofelectricity fromrenewable energy,supplying the grid.The exact value oftariff support is set bygovernment, usuallyfor a fixed time period,and tends to varyaccording to the type ofgeneration technology.Simpler than RECs, FITs havebeen successful in many OECDcountries, driving markets forwind and solar power where SMEparticipation is high for installationand operation. They are unlikeconventional subsidies in that theyare intended to spur market andtechnological development, drivingcost reductions in the process,normally by tapering tariff overtime. FITs are conceptually verysimple and easy to administer,offering clear financial riskmanagement for investors.However, once renewables take upa larger share of the generationmarket place, fixed-price (asopposed to market-based) FITs canbecome expensive and harder forgovernments to justify.The number ofyears offeredby the FIT is offundamentalimportance andcan range from5-30 years80+ countries worldwidehave legislated FITs,however the vast majorityof RET investmentssupported by FITs has beenin developed countries.This is partly because ofthe rapid uptake of FITs indeveloping countries since2009, following which thereis a delay during projectsare designed and investorsare mobilized. 46AdvancedmarketcommitmentA legal contractbetween publicor private entitiesthat guaranteesthe purchase of atechnology, subject tomeeting minimal, predefined,performancerequirementsA means to minimize investmentrisk in important but unproventechnologies, where payment is onlymade upon delivery. To date hasonly been used for the developmentof medicine and is most relevantin addressing specific technicalproblems or requirements.Of minimal relevance to cleantechnology, and its effectivenessdiminishes along with a high degreeof technological uncertainty.Technologyspecificandtime-boundPneumococcal Vaccinesupported by the GlobalAlliance for Vaccines andImmunizationontinued on next page44 For an assessment of the first year of REC trading in India, see: www.isb.edu/download/16739/Falling-Short-An-Evaluation-of-the-Indian-Renewable-Certificate-Market.pdf4546 For a comprehensive overview of FITs for developing countries, see: www.unep.org/pdf/UNEP_FIT_Report_2012F.pdf98 <strong>Building</strong> <strong>Competitive</strong> <strong>Green</strong> <strong>Industries</strong>: The Climate and Clean Technology Opportunity for Developing Countries
47 48 49 50TABLE C3. Market development (continued)Name ofinstrumentDescription ofinstrumentEvaluationCommitmentperiodExampleSustainableprocurement 47Purchasing policies bygovernments and largecorporations, wheredecision making takesinto account externalenvironmental andsocial costs, in additionto financial (internal)costsCan be a powerful means to drivedemand for clean technologyproducts and services asgovernments tend to be the singlelargest consumers in an economy.However the exact criteria can varysignificantly between organization,thus consumption that is radicallymore sustainable than “businessas usual” does not always occur.Policy continuitydrives long termdemand forclean technologyproducts andservicesIn 2007 the Federalgovernment of Brazilimposed publicprocurement criteria toensure the purchase oflegally-certified sustainablewood products, with criteriadesigned to increase theparticipation of SMEs.However more widereachingand progressivesocial and environmentcriteria has been legislatedby the State of Sao Paulo. 48Public rankingsA ranking ofcountries, businesses,organizations ormunicipalities basedon the production orconsumption of cleantechnologyAs with all rankings, resultsare the product of context-freecriteria that are unlikely to reflectfairly the performance of alltarget entities or jurisdictions,for the sake of comparison.While rankings can stimulate ahealthy degree of competition,and hence motivation to reachspecific targets, they can alsohave a counter-productive effectwhereby the “usual suspects” (forinstance, Scandinavia) dominatethe rankings, thus demotivatingothers and having a competitiveeffect only at the top.Most rankingsare publishedyearly and obtainstatus andfollowing overtimeThe Global Cleantechnology InnovationIndex, published by theClean technology Groupand WWF, first publishedin 2012 ranked Denmark,Israel, Sweden, Finland andthe United States as thetop-5 countries for cleantechnology innovation. 49CampaignsCan take many formsand be official (thatis, government-led),commercial, individualor community-basedand broad or specificin focusNeed to be simply, clearmessages most campaigns areconducted online and can lead to“crowdfunding” (that is, a largenumber of small contributions),especially relevant for diasporapopulations to support initiatives intheir home countriesNormally shortterm, targetedUNDP has supported acampaign to “crowdfund”solar energy for schoolsin Croatia, whichdemonstrated the powerof campaigns and thepotential of crowdfundingas a niche instrument. 50ontinued on next page47 For a generally overview of sustainable public procurement (SPP), see: http://esa.un.org/marrakechprocess/pdf/InnovationBriefs_no5.pdf48 See Brauch, M. (2012) “Sustainable Public Procurement in the Sao Paulo State Government” www.iisd.org/pdf/2012/spp_sao_paulo_brief.pdf49 For the full report, see: http://awsassets.panda.org/downloads/coming_clean_2012.pdf50 For more information on this campaign, see: www.al.undp.org/content/croatia/en/home/presscenter/articles/2013/12/02/crowdfunding-campaign-for-the-first-energy-independent-school-in-croatia-to-be-launched/Appendix C. Policy Options and Instruments99
- Page 3 and 4:
Building CompetitiveGreen Industrie
- Page 5 and 6:
ContentsForeword ..................
- Page 7 and 8:
AcknowledgmentsThis report was comm
- Page 9 and 10:
Photo: Simone D. McCourtie / World
- Page 11 and 12:
Photo: World Bank.FIGURE E1. Growth
- Page 13 and 14:
FIGURE E3. Top three regional oppor
- Page 15 and 16:
FIGURE E7. Areas for government sup
- Page 17 and 18:
Policy makers, in particular, must
- Page 19 and 20:
Photo: © Arne Hoel / World Bank.Th
- Page 21 and 22:
Other adaptation technologies (outs
- Page 23 and 24:
Photo: Dana Smillie / World Bank.de
- Page 25 and 26:
Photo: © Simone D. McCourtie / Wor
- Page 27 and 28:
oad transport. What coverage there
- Page 29 and 30:
The Regional PictureThe regional op
- Page 31 and 32:
years, and heat and electricity fro
- Page 33 and 34:
populations with mini-grids, and de
- Page 35 and 36:
FIGURE 2.10. Size of the clean tech
- Page 37 and 38:
energy sources. India enjoys among
- Page 39 and 40:
Photo: Nonie Reyes / World Bank.Ind
- Page 41 and 42:
TABLE 3.1. Activities in the value
- Page 43 and 44:
Photo: John Hoggs / World BankChapt
- Page 45 and 46:
Photo: Ray Witlin / World Bank.Sola
- Page 47 and 48:
FIGURE 4.1. Solar PV value chainMaj
- Page 49 and 50:
Figure 4.3. CSP value chainMajor eq
- Page 51 and 52:
Figure 4.5. Sectors in which Indian
- Page 53 and 54: Figure 4.9. Areas for government su
- Page 55 and 56: Photo: Curt Carnemark / World Bank.
- Page 57 and 58: SMEs focused on adapting or making
- Page 59 and 60: Spectre International, also known a
- Page 61 and 62: FIGURE 5.3. Investment in clean tec
- Page 63 and 64: FIGURE 5.6. Most common barriers fa
- Page 65 and 66: FIGURE 5.7. Areas for government su
- Page 67 and 68: Photo: Edwin Huffman / World Bank.f
- Page 69 and 70: BOX 6.2. Drying food to cut post-ha
- Page 71 and 72: Government Policy IsSupporting the
- Page 73 and 74: tailored at small scales to increas
- Page 75 and 76: BOX 6.5. SME opportunities in agrof
- Page 77 and 78: Photo: Curt Carnemark / World Bank.
- Page 79 and 80: of trust and openness, especially w
- Page 81 and 82: (RETs). For example, high demand fo
- Page 83 and 84: and technologies may be significant
- Page 85 and 86: Country ContextThere is limited emp
- Page 87 and 88: While policy change is not always a
- Page 89 and 90: Photo: Boris Balabanov / World Bank
- Page 91 and 92: TABLE A1. Market sizing methodology
- Page 93 and 94: TABLE B1. Renewables value chains (
- Page 95 and 96: TABLE B2. Water and sanitation valu
- Page 97 and 98: Appendix B. Value Chain Breakdowns9
- Page 99 and 100: TABLE C1. Entrepreneurship and busi
- Page 101 and 102: TABLE C2. Innovation financeName of
- Page 103: TABLE C3. Market developmentName of
- Page 107 and 108: 52 53 54 55 56TABLE C4. Technology
- Page 109 and 110: 61 62TABLE C4. Technology developme
- Page 111 and 112: 67 68 69TABLE C5. Legal and regulat
- Page 113 and 114: Aurum Ventures. 2013. “Home.” h
- Page 115 and 116: Department of Agriculture and Coope
- Page 117 and 118: Global Green Growth Institute. 2014
- Page 119 and 120: Kamal-Chaoui, L. et al. 2011. “Th
- Page 121 and 122: Nyang’ori, Ruth. 2010. “Factors
- Page 123 and 124: Sol Chip. 2013. “News & Events.
- Page 125 and 126: Wollenberg, Lini (Research Associat
- Page 128: ©2014 International Bank for Recon