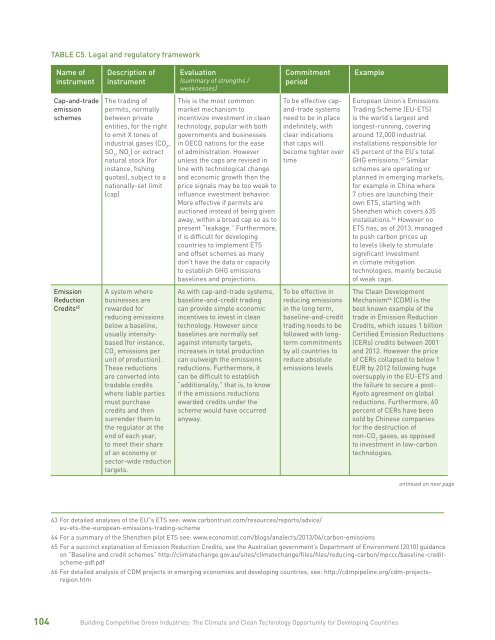
63 64 65 66TABLE C5. Legal and regulatory frameworkName ofinstrumentDescription ofinstrumentEvaluation .(summary of strengths /weaknesses)CommitmentperiodExampleCap-and-tradeemissionschemesThe trading ofpermits, normallybetween privateentities, for the rightto emit X tones ofindustrial gases (CO 2,SO 2, NO x) or extractnatural stock (forinstance, fishingquotas), subject to anationally-set limit(cap)This is the most commonmarket mechanism toincentivize investment in cleantechnology, popular with bothgovernments and businessesin OECD nations for the easeof administration. Howeverunless the caps are revised inline with technological changeand economic growth then theprice signals may be too weak toinfluence investment behavior.More effective if permits areauctioned instead of being givenaway, within a broad cap so as topresent “leakage.” Furthermore,it is difficult for developingcountries to implement ETSand offset schemes as manydon’t have the data or capacityto establish GHG emissionsbaselines and projections.To be effective capand-tradesystemsneed to be in placeindefinitely, withclear indicationsthat caps willbecome tighter overtimeEuropean Union‘s EmissionsTrading Scheme (EU-ETS)is the world‘s largest andlongest-running, coveringaround 12,000 industrialinstallations responsible for45 percent of the EU‘s totalGHG emissions. 63 Similarschemes are operating orplanned in emerging markets,for example in China where7 cities are launching theirown ETS, starting withShenzhen which covers 635installations. 64 However noETS has, as of 2013, managedto push carbon prices upto levels likely to stimulatesignificant investmentin climate mitigationtechnologies, mainly becauseof weak caps.EmissionReductionCredits 65A system wherebusinesses arerewarded forreducing emissionsbelow a baseline,usually intensitybased(for instance,CO 2emissions perunit of production).These reductionsare converted intotradable creditswhere liable partiesmust purchasecredits and thensurrender them tothe regulator at theend of each year,to meet their shareof an economy orsector-wide reductiontargets.As with cap-and-trade systems,baseline-and-credit tradingcan provide simple economicincentives to invest in cleantechnology. However sincebaselines are normally setagainst intensity targets,increases in total productioncan outweigh the emissionsreductions. Furthermore, itcan be difficult to establish“additionality,” that is, to knowif the emissions reductionsawarded credits under thescheme would have occurredanyway.To be effective inreducing emissionsin the long term,baseline-and-credittrading needs to befollowed with longtermcommitmentsby all countries toreduce absoluteemissions levelsThe Clean DevelopmentMechanism 66 (CDM) is thebest known example of thetrade in Emission ReductionCredits, which issues 1 billionCertified Emission Reductions(CERs) credits between 2001and 2012. However the priceof CERs collapsed to below 1EUR by 2012 following hugeoversupply in the EU-ETS andthe failure to secure a post-Kyoto agreement on globalreductions. Furthermore, 60percent of CERs have beensold by Chinese companiesfor the destruction ofnon-CO 2gases, as opposedto investment in low-carbontechnologies.ontinued on next page63 For detailed analyses of the EU”s ETS see: www.carbontrust.com/resources/reports/advice/eu-ets-the-european-emissions-trading-scheme64 For a summary of the Shenzhen pilot ETS see: www.economist.com/blogs/analects/2013/06/carbon-emissions65 For a succinct explanation of Emission Reduction Credits, see the Australian government’s Department of Environment (2010) guidanceon “Baseline and credit schemes” http://climatechange.gov.au/sites/climatechange/files/files/reducing-carbon/mpccc/baseline-creditscheme-pdf.pdf66 For detailed analysis of CDM projects in emerging economies and developing countries, see: http://cdmpipeline.org/cdm-projectsregion.htm104 <strong>Building</strong> <strong>Competitive</strong> <strong>Green</strong> <strong>Industries</strong>: The Climate and Clean Technology Opportunity for Developing Countries
67 68 69TABLE C5. Legal and regulatory framework (continued)Name ofinstrumentDescription ofinstrumentEvaluation .(summary of strengths /weaknesses)CommitmentperiodExampleTaxation onpollutionor naturalresource useTaxes can be leviedon specific pollutionoutputs or on theabstraction orconsumption ofnatural resourcesincluding water userfees, wastewaterdischarge fees, andsolid waste disposalfeesBorn out of the “polluterpays principle,” that is, thata company causing pollutionor resource extraction shouldpay for the cost of removingor replacing it, or providecompensation to those whohave been affected. While suchtaxes can raise revenue streamsto finance clean technologyventures and businessdevelopment they do not, unlikemarket-based mechanism,ensure pollution reductions.Rather they simply penalizeunsustainable behaviors, whichmay not trigger investment inclean technologies.As with mostfiscal measures,its effectivenessdepends uponsustainedgovernmentcommitmentAmong developing countries,India introduced a carbontax in 2010, though only forcoal, charged at $1.07 perton either produced in orimported to India. 67 SouthAfrica, as another carbonintensedeveloping economy,has embraced the idea ofa carbon tax, though hasdelayed implementation until2016. 68Import taxreductions orwaiversKey fiscal measurethat can be targetedfor specific cleantechnology importsCan assist clean technologySMEs that depend upon theimporting of specific, oftenhigh-tech, inputs. Most relevantto Less Developed Countries. Amain challenge is to maintain anup-to-date list of technologiesand associated equipment(such as inverters used for PVsystems) that is fair and notopen to abuse by traders whowould avoid tax but use theequipment for other, that is,nonclean technology, sectors.As with mostfiscal measures,its effectivenessdepends on stableand long-termcommitment fromgovernmentSenegal‘s 2010 RenewableEnergy (RE) Law includes a0 percent corporate incometax (normally 30 percent) forinvestors in RE and 0 percentVAT (normally 7 percent) forRE products and services,which has been of particularbenefit to the solar PVmarket. 69Attractingtalent (“stickycities”)Government policyto attract and retaintalent and humancapital throughincome tax breaksAims to attract creative andscientific talent for cleantechnology, especially relevantfor less developed countriesthat have suffered a “braindrain.” However needs to beimplemented in concert withother enabling policies andalso to significant enough totrigger a flow of talent to besuccessful. Policy risk is higherin the countries that would standto benefit most and eligibilityrequires strict oversight so as toavoid gaming.Strong topdownpoliticalcommitment andstability is key toeffectivenessVarious African governmentscommitted to the ideaunder the New Partnershipfor Africa‘s Development(NEPAD), though it has mostlybeen implemented on anad-hoc basis with no formalmechanisms in place ormeans to measure impact, todate.67 Information on country carbon taxes is compiled by KPMG: www.kpmg.com/Global/en/IssuesAndInsights/ArticlesPublications/greentax/Documents/kpmg-green-tax-index-2013.pdf68 News report of the South African government’s 2014 decision to delay carbon taxation until 2016: www.bloomberg.com/news/2014-02-26/south-africa-delays-carbon-tax-plans-levies-on-acid-mine-water.html69 See Senegal’s ‘Renewables Readiness Assessment’ (2012) published by the International Renewable Energy Agency (IRENA) www.irena.org/DocumentDownloads/Publications/IRENA per cent20Senegal per cent20RRA.pdfAppendix C. Policy Options and Instruments105
- Page 3 and 4:
Building CompetitiveGreen Industrie
- Page 5 and 6:
ContentsForeword ..................
- Page 7 and 8:
AcknowledgmentsThis report was comm
- Page 9 and 10:
Photo: Simone D. McCourtie / World
- Page 11 and 12:
Photo: World Bank.FIGURE E1. Growth
- Page 13 and 14:
FIGURE E3. Top three regional oppor
- Page 15 and 16:
FIGURE E7. Areas for government sup
- Page 17 and 18:
Policy makers, in particular, must
- Page 19 and 20:
Photo: © Arne Hoel / World Bank.Th
- Page 21 and 22:
Other adaptation technologies (outs
- Page 23 and 24:
Photo: Dana Smillie / World Bank.de
- Page 25 and 26:
Photo: © Simone D. McCourtie / Wor
- Page 27 and 28:
oad transport. What coverage there
- Page 29 and 30:
The Regional PictureThe regional op
- Page 31 and 32:
years, and heat and electricity fro
- Page 33 and 34:
populations with mini-grids, and de
- Page 35 and 36:
FIGURE 2.10. Size of the clean tech
- Page 37 and 38:
energy sources. India enjoys among
- Page 39 and 40:
Photo: Nonie Reyes / World Bank.Ind
- Page 41 and 42:
TABLE 3.1. Activities in the value
- Page 43 and 44:
Photo: John Hoggs / World BankChapt
- Page 45 and 46:
Photo: Ray Witlin / World Bank.Sola
- Page 47 and 48:
FIGURE 4.1. Solar PV value chainMaj
- Page 49 and 50:
Figure 4.3. CSP value chainMajor eq
- Page 51 and 52:
Figure 4.5. Sectors in which Indian
- Page 53 and 54:
Figure 4.9. Areas for government su
- Page 55 and 56:
Photo: Curt Carnemark / World Bank.
- Page 57 and 58:
SMEs focused on adapting or making
- Page 59 and 60: Spectre International, also known a
- Page 61 and 62: FIGURE 5.3. Investment in clean tec
- Page 63 and 64: FIGURE 5.6. Most common barriers fa
- Page 65 and 66: FIGURE 5.7. Areas for government su
- Page 67 and 68: Photo: Edwin Huffman / World Bank.f
- Page 69 and 70: BOX 6.2. Drying food to cut post-ha
- Page 71 and 72: Government Policy IsSupporting the
- Page 73 and 74: tailored at small scales to increas
- Page 75 and 76: BOX 6.5. SME opportunities in agrof
- Page 77 and 78: Photo: Curt Carnemark / World Bank.
- Page 79 and 80: of trust and openness, especially w
- Page 81 and 82: (RETs). For example, high demand fo
- Page 83 and 84: and technologies may be significant
- Page 85 and 86: Country ContextThere is limited emp
- Page 87 and 88: While policy change is not always a
- Page 89 and 90: Photo: Boris Balabanov / World Bank
- Page 91 and 92: TABLE A1. Market sizing methodology
- Page 93 and 94: TABLE B1. Renewables value chains (
- Page 95 and 96: TABLE B2. Water and sanitation valu
- Page 97 and 98: Appendix B. Value Chain Breakdowns9
- Page 99 and 100: TABLE C1. Entrepreneurship and busi
- Page 101 and 102: TABLE C2. Innovation financeName of
- Page 103 and 104: TABLE C3. Market developmentName of
- Page 105 and 106: 47 48 49 50TABLE C3. Market develop
- Page 107 and 108: 52 53 54 55 56TABLE C4. Technology
- Page 109: 61 62TABLE C4. Technology developme
- Page 113 and 114: Aurum Ventures. 2013. “Home.” h
- Page 115 and 116: Department of Agriculture and Coope
- Page 117 and 118: Global Green Growth Institute. 2014
- Page 119 and 120: Kamal-Chaoui, L. et al. 2011. “Th
- Page 121 and 122: Nyang’ori, Ruth. 2010. “Factors
- Page 123 and 124: Sol Chip. 2013. “News & Events.
- Page 125 and 126: Wollenberg, Lini (Research Associat
- Page 128: ©2014 International Bank for Recon