MEMORIAINSTITUCIONAL
Memoria Anual 2009 - Fondo MIVIVIENDA
Memoria Anual 2009 - Fondo MIVIVIENDA

You also want an ePaper? Increase the reach of your titles
YUMPU automatically turns print PDFs into web optimized ePapers that Google loves.
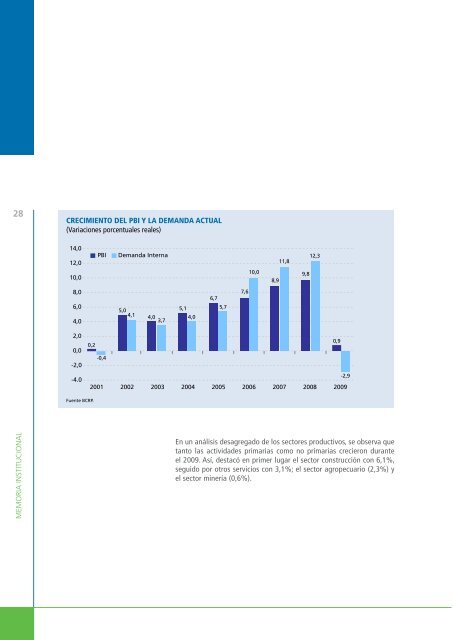
28 29CRECIMIENTO DEL PBI Y LA DEMANDA ACTUALPRODUCTO BRUTO INTERNO(Variaciones porcentuales reales)(Variaciones porcentuales reales respecto a similar periodo del año anterior)14,0 - - - - - - - - - - - - - - - - - - - - - - - - - - - - - - - - - - - - - - - - - - - - - - - - - - - - - - - - - - - - - - - - - - - - - - - - -PBI Demanda Interna12,312,0 - - - - - - - - - - - - - - - - - - - - - - - - - - - - - - - - - - - - - - - - - - - - - - - - - - - - - 11,8 - - - - - - - - - - - - - - - - - - - -10,09,810,0 - - - - - - - - - - - - - - - - - - - - - - - - - - - - - - - - - - - - - - - - - - - - - - - - - - - - - - - - - - - - - - - - - - - - - - - - -8,98,0 - - - - - - - - - - - - - - - - - - - - - - - - - - - - - - - - - - - - - - - - - - - 7,6 - - - - - - - - - - - - - - - - - - - - - - - - - - - - - -6,76,0 - - - - - - - - - - - - - - - - - - - - - - - - - - - - - - - - - - - - - - - - - - - - - - - - - - - - - - - - - - - - - - - - - - - - - - - - -5,0 5,15,74,1 4,0 4,04,0 - - - - - - - - - - - - - - - - - - - - - 3,7 - - - - - - - - - - - - - - - - - - - - - - - - - - - - - - - - - - - - - - - - - - - - - - - - - - - -2,0 - - - - - - - - - - - - - - - - - - - - - - - - - - - - - - - - - - - - - - - - - - - - - - - - - - - - - - - - - - - - - - - - - - - - - - - - -0,90,20,0 - - - - - - - - - - - - - - - - - - - - - - - - - - - - - - - - - - - - - - - - - - - - - - - - - - - - - - - - - - - - - - - - - - - - - - - - --0,4-2,0 - - - - - - - - - - - - - - - - - - - - - - - - - - - - - - - - - - - - - - - - - - - - - - - - - - - - - - - - - - - - - - - - - - - - - - - - --2,9-4.0 - - - - - - - - - - - - - - - - - - - - - - - - - - - - - - - - - - - - - - - - - - - - - - - - - - - - - - - - - - - - - - - - - - - - - - - - -2001 2002 2003 2004 2005 2006 2007 2008 2009Fuente BCRP.AgropecuarioAgricolaPecuarioPescaMinería e hidrocarburosMineria metálicaHidrocarburosManufacturaProcesadores de recursos primariosManufactura no primariaElectricidad y aguaConstrucciónComercioOtros serviciosPBI GLOBALPrimarioNo PrimarioFuente BCRP.2008 2009Año I Trim. II Trim. III Trim. IV Trim. Año7,27,46,06,37,67,310,39,17,68,97,716,513,09,19,87,410,34,43,65,6-14,23,70,930,4-4,23,9-5,71,25,10,43,71,93,51,61,1-0,24,21,40,5-1,016,7-11,62,2-14,40,3-1,1-2,11,7-1,21,1-1,72,30,44,7-6,10,1-2,018,4-10,30,7-12,1-0,34,9-1,81,8-0,61,0-0,91,90,83,2-14,6-1,6-3,23,4-2,3-6,3-1,63,414,82,25,23,4-1,44,42,30,94,4-7,90,6-1,416,1-7,20,0-8,51,26,1-0,43,10,91,00,8MEMORIA INSTITUCIONALEn un análisis desagregado de los sectores productivos, se observa quetanto las actividades primarias como no primarias crecieron duranteel 2009. Así, destacó en primer lugar el sector construcción con 6,1%,seguido por otros servicios con 3,1%; el sector agropecuario (2,3%) yel sector minería (0,6%).