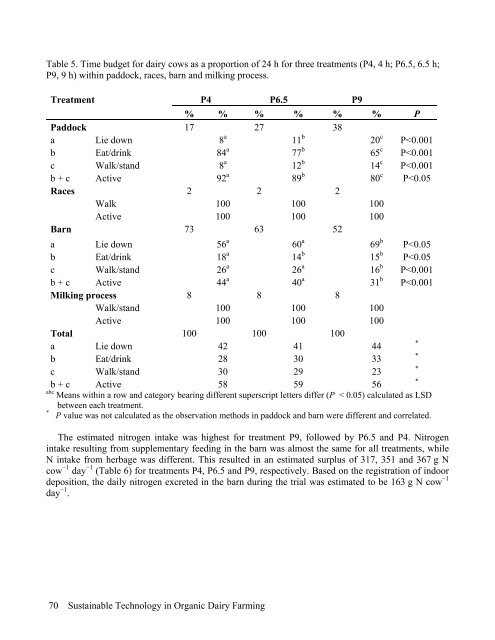
Table 5. Time budget for dairy cows as a proportion <strong>of</strong> 24 h for three treatments (P4, 4 h; P6.5, 6.5 h; P9, 9 h) within paddock, races, barn <strong>and</strong> milking process. Treatment P4 P6.5 P9 % % % % % % P Paddock 17 27 38 a Lie down 8 a 11 b 20 c P
Table 6. Nitrogen (N) balance at cow level estimated for three pasturing treatments (P4, 4 h; P6.5, 6.5 h; P9, 9 h) in g N cow −1 day −1 Treatment P4 P6.5 P9 Input Output Input Output Input Output Supplements 186 186 176 Herbage 285 331 369 Milk 153 160 168 Bodyweight 1 6 10 Sum 471 154 517 166 545 178 Surplus 317 351 367 4.4 Discussion 4.4.1 Urination <strong>and</strong> defecation frequency Dairy cows are stated to urinate <strong>and</strong> defecate 12 times per day (Lantinga et al., 1987), while other research registrations note between 6 <strong>and</strong> 10 times per day (Van Duinkerken et al., 2000). Stress is said to have some influence on the frequency, indicating that when imposing constraint, the frequency increases (Friend, 1991). The frequency <strong>of</strong> urination <strong>and</strong> defecation was in this experiment measured by two totally different methods. The first method was based on continuous observation <strong>of</strong> the group <strong>of</strong> 20 animals in the field. The second method was alternating every 5 minutes between behaviour registration <strong>and</strong> counting defecation <strong>and</strong> urination. The two sets <strong>of</strong> data confirm each other (Table 1), with an average frequency per day (urination: 6.5; defecation: 10.5) within the cited frequencies reported in the literature (Betteridge et al., 1986). The results show there is no difference in urination <strong>and</strong> defecation frequency per active hour compared with the total hours at pasture, even though the percentage <strong>of</strong> active time decreased with time spent outdoors. 4.4.2 Spatial distribution <strong>of</strong> excrement In the period when this experiment was undertaken there were measured minimum temperatures between 5 <strong>and</strong> 12°C <strong>and</strong> maximum temperatures between 13 <strong>and</strong> 28°C. The research done by White et al. (2001) suggests that, especially during warm periods, the distribution tends to be close to the water trough, due to frequent drinking. In our experiment no correlations were found between excrement pattern <strong>and</strong> dry weather, but the grazing time was limited to a maximum <strong>of</strong> 9 h, meaning that the cows could always drink in the barn. Only very few drinking observations were registered in the field (44 out <strong>of</strong> 5942 observations). This could explain why the allocation <strong>of</strong> excrement was not specifically higher in the quadrate where water was supplied. Research done with other grazing animals (pigs <strong>and</strong> beef cattle) shows higher concentrations <strong>of</strong> minerals originating from excrement around drinking or fodder troughs (Franzluebbers et al., 2000; Eriksen <strong>and</strong> Kristensen, 2001). The r<strong>and</strong>om spread <strong>of</strong> urinations <strong>and</strong> defecations in our experiment, for all three treatments, can be considered as positive in order to prevent excessive leaching from local hot-spots. The fact that the cows in all treatments were relatively busy grazing <strong>and</strong> moving around could have influenced this distribution in the field. Even though the cows in treatment P9, grazing for 9 h, had relatively more ‘free’ time, they did not use the time for drinking more. Other behavioural research has documented that cows’ second preference is for lying down, after the need to eat (Munksgaard et al., 2005). Thesis Frank W. Oudshoorn 71
- Page 1 and 2:
Innovative Technology and Sustainab
- Page 3 and 4:
Innovative Technology and Sustainab
- Page 5 and 6:
Abstract Development of organic dai
- Page 7:
Contents 1 General introduction 9 2
- Page 10 and 11:
1.1 Organic dairy farming in Denmar
- Page 12 and 13:
1.2 Organic agriculture, technology
- Page 14 and 15:
a. What are the economic, ecologica
- Page 16 and 17:
References Anonymous, 1977. Eindrap
- Page 18 and 19:
18 Sustainable Technology in Organi
- Page 20 and 21: Abstract The aim of this study was
- Page 22 and 23: Table 2. Structural development of
- Page 24 and 25: negative influences on milk quality
- Page 26 and 27: consumption, therefore, were not br
- Page 28 and 29: According to the advisors, reasons
- Page 30 and 31: Table 5. Dutch (NL) and Danish (DK)
- Page 32 and 33: 2.5 Discussion 2.5.1 Perceptions: D
- Page 34 and 35: ecause of a recently published arti
- Page 36 and 37: References Alrøe, Hugo and Erik St
- Page 38 and 39: [Dairy Production Economy]. Ed. M.
- Page 40 and 41: Abstract The objective of this rese
- Page 42 and 43: data set. As the size of the herd w
- Page 44 and 45: The N output was computed as the N
- Page 46 and 47: of necessary supplementary silage (
- Page 48 and 49: was compensated by the above-mentio
- Page 50 and 51: level. The most important reason fo
- Page 52 and 53: Animal Health Culling rate was foun
- Page 54 and 55: An inquiry made on motivations to i
- Page 56 and 57: References Anderson, T. W., and D.
- Page 58 and 59: Strudsholm, F., and K. Sejersen. 20
- Page 60 and 61: Abstract The objective of this pape
- Page 62 and 63: 4.2.2 Sward and herd management Thr
- Page 64 and 65: Kristensen et al. (2007). Indoor ex
- Page 66 and 67: Treatment P4, 4 hours of grazing, f
- Page 68 and 69: Table 3. Total number of defecation
- Page 72 and 73: No significant correlation was foun
- Page 74 and 75: 4.4.3 Walking pattern and velocity
- Page 76 and 77: When using either total time or act
- Page 78 and 79: Poulsen, H.D., Kristensen, V.F., 19
- Page 80 and 81: Abstract The objective of this stud
- Page 82 and 83: practices in Denmark. Objections br
- Page 84 and 85: evaluated based on a costs-benefit
- Page 86 and 87: is found to be associated with redu
- Page 88 and 89: However, we assumed a minor increas
- Page 90 and 91: lactation months when the minimum i
- Page 92 and 93: Economic evaluation For each scenar
- Page 94 and 95: 310 for N2O). GHG emissions are com
- Page 96 and 97: Table 6. Production parameters esti
- Page 98 and 99: include the purchase of heifers as
- Page 100 and 101: social dimension in the analysis. I
- Page 102 and 103: Often “kg milk” (fat corrected
- Page 104 and 105: References Alrøe, H.F. Noe, E. 200
- Page 106 and 107: IFOAM, 2008. Principles of organic
- Page 108 and 109: Swedish Dairy Farming. Report FOOD2
- Page 110 and 111: 6.1 Introduction In this chapter th
- Page 112 and 113: quantity, besides from being an imp
- Page 114 and 115: additional money, and research shou
- Page 116 and 117: area, weather, control of grass gro
- Page 118 and 119: dairy industry, retail and consumer
- Page 120 and 121:
6.3.5 Mobile automatic milking Scen
- Page 122 and 123:
6.4 General Conclusions The conclus
- Page 124 and 125:
Hovi, M., A., Sundrum, A., Thamsbor
- Page 126 and 127:
Summary Organic agriculture provide
- Page 128 and 129:
Cows allowed grazing at pasture for
- Page 130 and 131:
Samenvatting De biologische landbou
- Page 132 and 133:
Dit is onderzocht in een beweidingp
- Page 134 and 135:
Resumé Økologisk landbrug leverer
- Page 136 and 137:
afgræsning med mælk fra ni timers
- Page 138 and 139:
Future Perspectives Based on the re
- Page 140 and 141:
Oudshoorn, F. W. , Nadimi, E. S. 20