Innovative Technology and Sustainable Development of Organic - 1.
Innovative Technology and Sustainable Development of Organic - 1.
Innovative Technology and Sustainable Development of Organic - 1.

You also want an ePaper? Increase the reach of your titles
YUMPU automatically turns print PDFs into web optimized ePapers that Google loves.
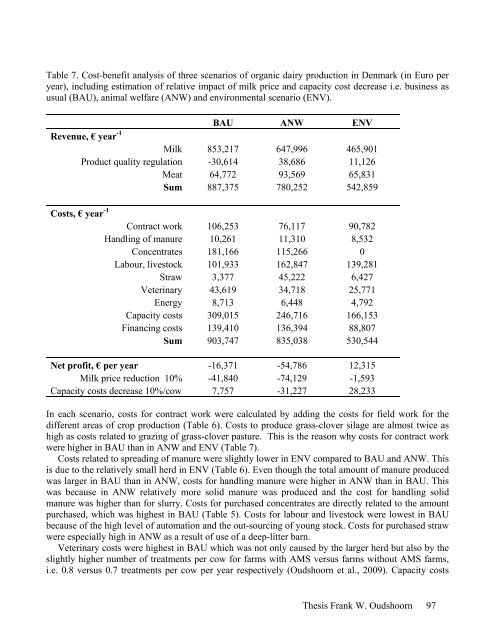
Table 7. Cost-benefit analysis <strong>of</strong> three scenarios <strong>of</strong> organic dairy production in Denmark (in Euro per<br />
year), including estimation <strong>of</strong> relative impact <strong>of</strong> milk price <strong>and</strong> capacity cost decrease i.e. business as<br />
usual (BAU), animal welfare (ANW) <strong>and</strong> environmental scenario (ENV).<br />
Revenue, € year -1<br />
BAU ANW ENV<br />
Milk 853,217 647,996 465,901<br />
Product quality regulation -30,614 38,686 11,126<br />
Meat 64,772 93,569 65,831<br />
Sum 887,375 780,252 542,859<br />
Costs, € year -1<br />
Contract work 106,253 76,117 90,782<br />
H<strong>and</strong>ling <strong>of</strong> manure 10,261 11,310 8,532<br />
Concentrates 181,166 115,266 0<br />
Labour, livestock 101,933 162,847 139,281<br />
Straw 3,377 45,222 6,427<br />
Veterinary 43,619 34,718 25,771<br />
Energy 8,713 6,448 4,792<br />
Capacity costs 309,015 246,716 166,153<br />
Financing costs 139,410 136,394 88,807<br />
Sum 903,747 835,038 530,544<br />
Net pr<strong>of</strong>it, € per year -16,371 -54,786 12,315<br />
Milk price reduction 10% -41,840 -74,129 -1,593<br />
Capacity costs decrease 10%/cow 7,757 -31,227 28,233<br />
In each scenario, costs for contract work were calculated by adding the costs for field work for the<br />
different areas <strong>of</strong> crop production (Table 6). Costs to produce grass-clover silage are almost twice as<br />
high as costs related to grazing <strong>of</strong> grass-clover pasture. This is the reason why costs for contract work<br />
were higher in BAU than in ANW <strong>and</strong> ENV (Table 7).<br />
Costs related to spreading <strong>of</strong> manure were slightly lower in ENV compared to BAU <strong>and</strong> ANW. This<br />
is due to the relatively small herd in ENV (Table 6). Even though the total amount <strong>of</strong> manure produced<br />
was larger in BAU than in ANW, costs for h<strong>and</strong>ling manure were higher in ANW than in BAU. This<br />
was because in ANW relatively more solid manure was produced <strong>and</strong> the cost for h<strong>and</strong>ling solid<br />
manure was higher than for slurry. Costs for purchased concentrates are directly related to the amount<br />
purchased, which was highest in BAU (Table 5). Costs for labour <strong>and</strong> livestock were lowest in BAU<br />
because <strong>of</strong> the high level <strong>of</strong> automation <strong>and</strong> the out-sourcing <strong>of</strong> young stock. Costs for purchased straw<br />
were especially high in ANW as a result <strong>of</strong> use <strong>of</strong> a deep-litter barn.<br />
Veterinary costs were highest in BAU which was not only caused by the larger herd but also by the<br />
slightly higher number <strong>of</strong> treatments per cow for farms with AMS versus farms without AMS farms,<br />
i.e. 0.8 versus 0.7 treatments per cow per year respectively (Oudshoorn et al., 2009). Capacity costs<br />
Thesis Frank W. Oudshoorn 97