Recommendations
ACC/AHA/SCAI PCI Guidelines - British Cardiovascular Intervention ...
ACC/AHA/SCAI PCI Guidelines - British Cardiovascular Intervention ...
- No tags were found...

You also want an ePaper? Increase the reach of your titles
YUMPU automatically turns print PDFs into web optimized ePapers that Google loves.
34<br />
Smith et al. 2005<br />
ACC/AHA/SCAI Practice Guidelines<br />
ACC - www.acc.org<br />
AHA - www.americanheart.org<br />
SCAI - www.scai.org<br />
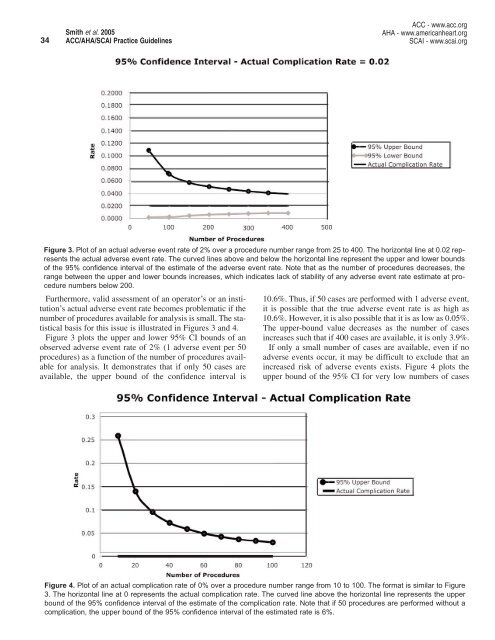
Figure 3. Plot of an actual adverse event rate of 2% over a procedure number range from 25 to 400. The horizontal line at 0.02 represents<br />
the actual adverse event rate. The curved lines above and below the horizontal line represent the upper and lower bounds<br />
of the 95% confidence interval of the estimate of the adverse event rate. Note that as the number of procedures decreases, the<br />
range between the upper and lower bounds increases, which indicates lack of stability of any adverse event rate estimate at procedure<br />
numbers below 200.<br />
Furthermore, valid assessment of an operator’s or an institution’s<br />
actual adverse event rate becomes problematic if the<br />
number of procedures available for analysis is small. The statistical<br />
basis for this issue is illustrated in Figures 3 and 4.<br />
Figure 3 plots the upper and lower 95% CI bounds of an<br />
observed adverse event rate of 2% (1 adverse event per 50<br />
procedures) as a function of the number of procedures available<br />
for analysis. It demonstrates that if only 50 cases are<br />
available, the upper bound of the confidence interval is<br />
10.6%. Thus, if 50 cases are performed with 1 adverse event,<br />
it is possible that the true adverse event rate is as high as<br />
10.6%. However, it is also possible that it is as low as 0.05%.<br />
The upper-bound value decreases as the number of cases<br />
increases such that if 400 cases are available, it is only 3.9%.<br />
If only a small number of cases are available, even if no<br />
adverse events occur, it may be difficult to exclude that an<br />
increased risk of adverse events exists. Figure 4 plots the<br />
upper bound of the 95% CI for very low numbers of cases<br />
Figure 4. Plot of an actual complication rate of 0% over a procedure number range from 10 to 100. The format is similar to Figure<br />
3. The horizontal line at 0 represents the actual complication rate. The curved line above the horizontal line represents the upper<br />
bound of the 95% confidence interval of the estimate of the complication rate. Note that if 50 procedures are performed without a<br />
complication, the upper bound of the 95% confidence interval of the estimated rate is 6%.