Valueat-Risk
Forecasting the Return Distribution Using High-Frequency Volatility ...
Forecasting the Return Distribution Using High-Frequency Volatility ...
- No tags were found...

Create successful ePaper yourself
Turn your PDF publications into a flip-book with our unique Google optimized e-Paper software.
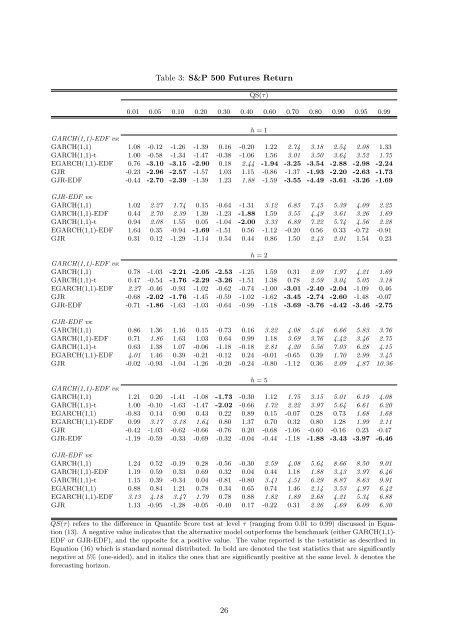
Table 3: S&P 500 Futures Return<br />
QS(τ)<br />
0.01 0.05 0.10 0.20 0.30 0.40 0.60 0.70 0.80 0.90 0.95 0.99<br />
h = 1<br />
GARCH(1,1)-EDF vs:<br />
GARCH(1,1) 1.08 -0.12 -1.26 -1.39 0.16 -0.20 1.22 2.74 3.18 2.54 2.08 1.33<br />
GARCH(1,1)-t 1.00 -0.58 -1.34 -1.47 -0.38 -1.06 1.56 3.01 3.50 3.64 3.52 1.75<br />
EGARCH(1,1)-EDF 0.76 -3.10 -3.15 -2.90 0.18 2.44 -1.94 -3.25 -3.54 -2.88 -2.98 -2.24<br />
GJR -0.23 -2.96 -2.57 -1.57 1.03 1.15 -0.86 -1.37 -1.93 -2.20 -2.63 -1.73<br />
GJR-EDF -0.44 -2.70 -2.39 -1.39 1.23 1.88 -1.59 -3.55 -4.49 -3.61 -3.26 -1.69<br />
GJR-EDF vs:<br />
GARCH(1,1) 1.02 2.27 1.74 0.15 -0.64 -1.31 3.12 6.85 7.45 5.39 4.09 2.25<br />
GARCH(1,1)-EDF 0.44 2.70 2.39 1.39 -1.23 -1.88 1.59 3.55 4.49 3.61 3.26 1.69<br />
GARCH(1,1)-t 0.94 2.08 1.55 0.05 -1.04 -2.00 3.33 6.89 7.22 5.74 4.56 2.28<br />
EGARCH(1,1)-EDF 1.64 0.35 -0.94 -1.69 -1.51 0.56 -1.12 -0.20 0.56 0.33 -0.72 -0.91<br />
GJR 0.31 0.12 -1.29 -1.14 0.54 0.44 0.86 1.50 2.43 2.01 1.54 0.23<br />
h = 2<br />
GARCH(1,1)-EDF vs:<br />
GARCH(1,1) 0.78 -1.03 -2.21 -2.05 -2.53 -1.25 1.59 0.31 2.09 1.97 4.21 1.69<br />
GARCH(1,1)-t 0.47 -0.54 -1.76 -2.29 -3.26 -1.51 1.38 0.78 2.59 3.04 5.05 3.18<br />
EGARCH(1,1)-EDF 2.27 -0.46 -0.93 -1.02 -0.62 -0.74 -1.00 -3.01 -2.40 -2.04 -1.09 0.46<br />
GJR -0.68 -2.02 -1.76 -1.45 -0.59 -1.02 -1.62 -3.45 -2.74 -2.60 -1.48 -0.07<br />
GJR-EDF -0.71 -1.86 -1.63 -1.03 -0.64 -0.99 -1.18 -3.69 -3.76 -4.42 -3.46 -2.75<br />
GJR-EDF vs:<br />
GARCH(1,1) 0.86 1.36 1.16 0.15 -0.73 0.16 3.22 4.08 5.46 6.66 5.83 3.76<br />
GARCH(1,1)-EDF 0.71 1.86 1.63 1.03 0.64 0.99 1.18 3.69 3.76 4.42 3.46 2.75<br />
GARCH(1,1)-t 0.63 1.38 1.07 -0.06 -1.18 -0.18 2.81 4.20 5.56 7.03 6.28 4.15<br />
EGARCH(1,1)-EDF 4.01 1.46 0.39 -0.21 -0.12 0.24 -0.01 -0.65 0.39 1.70 2.99 3.45<br />
GJR -0.02 -0.93 -1.04 -1.26 -0.20 -0.24 -0.80 -1.12 0.36 2.09 4.87 10.36<br />
h = 5<br />
GARCH(1,1)-EDF vs:<br />
GARCH(1,1) 1.21 0.20 -1.41 -1.08 -1.73 -0.30 1.12 1.75 3.15 5.01 6.19 4.08<br />
GARCH(1,1)-t 1.00 -0.10 -1.63 -1.47 -2.02 -0.66 1.72 2.22 3.97 5.64 6.61 6.20<br />
EGARCH(1,1) -0.83 0.14 0.90 0.43 0.22 0.89 0.15 -0.07 0.28 0.73 1.68 1.68<br />
EGARCH(1,1)-EDF 0.99 3.17 3.18 1.64 0.80 1.37 0.70 0.32 0.80 1.28 1.99 2.11<br />
GJR -0.42 -1.03 -0.62 -0.66 -0.76 0.20 -0.68 -1.06 -0.60 -0.16 0.23 -0.47<br />
GJR-EDF -1.19 -0.59 -0.33 -0.69 -0.32 -0.04 -0.44 -1.18 -1.88 -3.43 -3.97 -6.46<br />
GJR-EDF vs:<br />
GARCH(1,1) 1.24 0.52 -0.19 0.28 -0.56 -0.30 2.59 4.08 5.64 8.66 8.50 9.01<br />
GARCH(1,1)-EDF 1.19 0.59 0.33 0.69 0.32 0.04 0.44 1.18 1.88 3.43 3.97 6.46<br />
GARCH(1,1)-t 1.15 0.39 -0.34 0.04 -0.81 -0.80 3.41 4.51 6.29 8.87 8.63 9.91<br />
EGARCH(1,1) 0.88 0.84 1.21 0.78 0.34 0.65 0.74 1.46 2.14 3.53 4.97 6.42<br />
EGARCH(1,1)-EDF 3.13 4.18 3.47 1.79 0.78 0.88 1.82 1.89 2.68 4.21 5.34 6.88<br />
GJR 1.13 -0.95 -1.28 -0.05 -0.40 0.17 -0.22 0.31 2.26 4.69 6.09 6.30<br />
QS(τ) refers to the difference in Quantile Score test at level τ (ranging from 0.01 to 0.99) discussed in Equation<br />
(13). A negative value indicates that the alternative model outperforms the benchmark (either GARCH(1,1)-<br />
EDF or GJR-EDF), and the opposite for a positive value. The value reported is the t-statistic as described in<br />
Equation (16) which is standard normal distributed. In bold are denoted the test statistics that are significantly<br />
negative at 5% (one-sided), and in italics the ones that are significantly positive at the same level. h denotes the<br />
forecasting horizon.<br />
26