Valueat-Risk
Forecasting the Return Distribution Using High-Frequency Volatility ...
Forecasting the Return Distribution Using High-Frequency Volatility ...
- No tags were found...

Create successful ePaper yourself
Turn your PDF publications into a flip-book with our unique Google optimized e-Paper software.
τ=0.25<br />
τ=0.75<br />
−1.6 −1.4 −1.2 −1.0 −0.8 −0.6 −0.4<br />
rv t , rv t w , rv t<br />
m<br />
GARCH(1,1)−EDF<br />
GJR−EDF<br />
1.0 1.5 2.0<br />
rv t , rv t w , rv t<br />
m<br />
GARCH(1,1)−EDF<br />
GJR−EDF<br />
−4 −2 0 2 4<br />
r t+1<br />
−4 −2 0 2 4<br />
r t+1<br />
(a)<br />
(b)<br />
τ=0.025<br />
τ=0.975<br />
rv t , rv t w , rv t<br />
m<br />
GARCH(1,1)−EDF<br />
GJR−EDF<br />
rv t , rv t w , rv t<br />
m<br />
GARCH(1,1)−EDF<br />
GJR−EDF<br />
−6 −5 −4 −3 −2<br />
2 3 4 5<br />
−4 −2 0 2 4<br />
−4 −2 0 2 4<br />
r t+1<br />
r t+1<br />
(c)<br />
(d)<br />
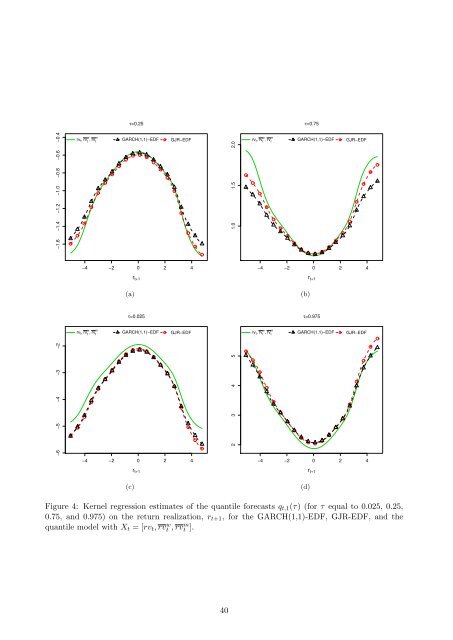
Figure 4: Kernel regression estimates of the quantile forecasts q t,1 (τ) (for τ equal to 0.025, 0.25,<br />
0.75, and 0.975) on the return realization, r t+1 , for the GARCH(1,1)-EDF, GJR-EDF, and the<br />
quantile model with X t = [rv t , rv w t , rv m t ].<br />
40