Matvec Users’ Guide
Matvec Users' Guide
Matvec Users' Guide
- No tags were found...

You also want an ePaper? Increase the reach of your titles
YUMPU automatically turns print PDFs into web optimized ePapers that Google loves.
8.3. EXAMPLES 49<br />
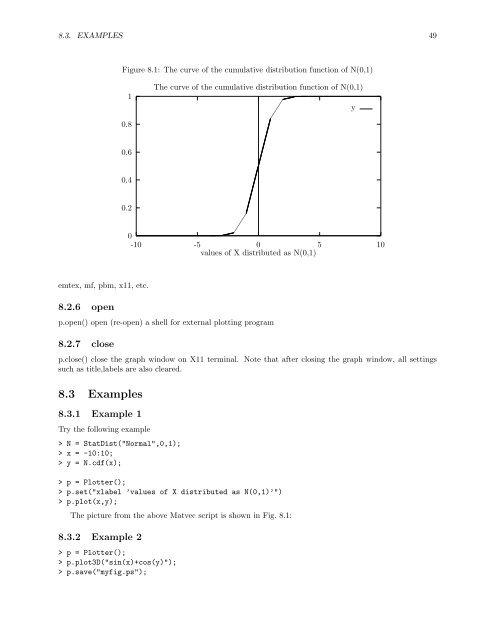
Figure 8.1: The curve of the cumulative distribution function of N(0,1)<br />
1<br />
The curve of the cumulative distribution function of N(0,1)<br />
y<br />
0.8<br />
0.6<br />
0.4<br />
0.2<br />
0<br />
-10 -5 0 5 10<br />
values of X distributed as N(0,1)<br />
emtex, mf, pbm, x11, etc.<br />
8.2.6 open<br />
p.open() open (re-open) a shell for external plotting program<br />
8.2.7 close<br />
p.close() close the graph window on X11 terminal. Note that after closing the graph window, all settings<br />
such as title,labels are also cleared.<br />
8.3 Examples<br />
8.3.1 Example 1<br />
Try the following example<br />
> N = StatDist("Normal",0,1);<br />
> x = -10:10;<br />
> y = N.cdf(x);<br />
> p = Plotter();<br />
> p.set("xlabel ’values of X distributed as N(0,1)’")<br />
> p.plot(x,y);<br />
The picture from the above <strong>Matvec</strong> script is shown in Fig. 8.1:<br />
8.3.2 Example 2<br />
> p = Plotter();<br />
> p.plot3D("sin(x)+cos(y)");<br />
> p.save("myfig.ps");