eQUEST Training Module 1
eQUEST Training Module 1 - Integrated Design Lab - Bozeman
eQUEST Training Module 1 - Integrated Design Lab - Bozeman
- No tags were found...

You also want an ePaper? Increase the reach of your titles
YUMPU automatically turns print PDFs into web optimized ePapers that Google loves.
Single-Run Reports<br />
<strong>eQUEST</strong> <strong>Module</strong> 1<br />
Monthly Electric Peak Day Load Profiles<br />
MODULE TEXT<br />
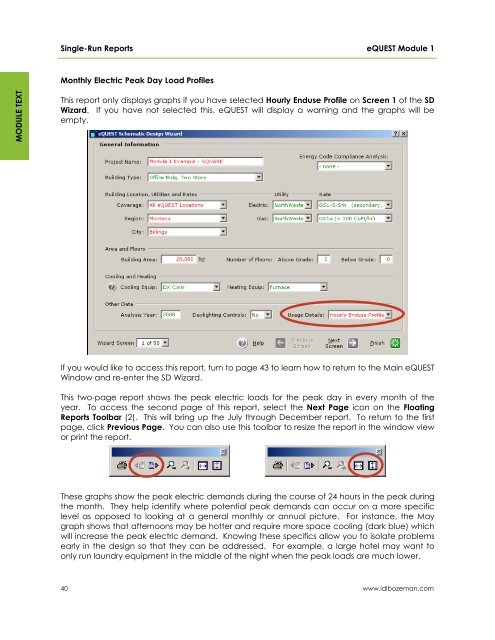
This report only displays graphs if you have selected Hourly Enduse Profile on Screen 1 of the SD<br />
Wizard. If you have not selected this, <strong>eQUEST</strong> will display a warning and the graphs will be<br />
empty.<br />
If you would like to access this report, turn to page 43 to learn how to return to the Main <strong>eQUEST</strong><br />
Window and re-enter the SD Wizard.<br />
This two-page report shows the peak electric loads for the peak day in every month of the<br />
year. To access the second page of this report, select the Next Page icon on the Floating<br />
Reports Toolbar (2). This will bring up the July through December report. To return to the first<br />
page, click Previous Page. You can also use this toolbar to resize the report in the window view<br />
or print the report.<br />
These graphs show the peak electric demands during the course of 24 hours in the peak during<br />
the month. They help identify where potential peak demands can occur on a more specific<br />
level as opposed to looking at a general monthly or annual picture. For instance, the May<br />
graph shows that afternoons may be hotter and require more space cooling (dark blue) which<br />
will increase the peak electric demand. Knowing these specifics allow you to isolate problems<br />
early in the design so that they can be addressed. For example, a large hotel may want to<br />
only run laundry equipment in the middle of the night when the peak loads are much lower.<br />
40<br />
www.idlbozeman.com