BULETINUL INSTITUTULUI POLITEHNIC DIN IAŞI
buletinul institutului politehnic din iaşi - Universitatea Tehnică ...
buletinul institutului politehnic din iaşi - Universitatea Tehnică ...
- No tags were found...
Create successful ePaper yourself
Turn your PDF publications into a flip-book with our unique Google optimized e-Paper software.
Bul. Inst. Polit. Iaşi, t. LVIII (LXII), f. 3, 2012 31<br />
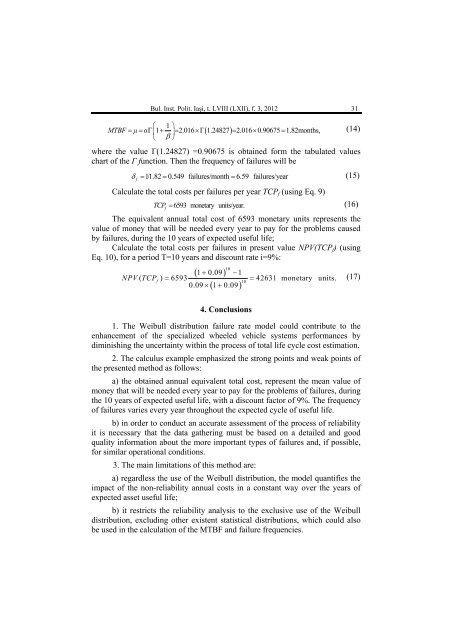
⎛ 1 ⎞<br />
MTBF = μ= αΓ ⎜1+ ⎟= 2.016×Γ ( 1.24827)<br />
= 2.016× 0.90675 = 1.82months,<br />
⎝ β ⎠<br />
(14)<br />
where the value Γ(1.24827) =0.90675 is obtained form the tabulated values<br />
chart of the Γ function. Then the frequency of failures will be<br />
δ = 1/1.82 = 0.549 failures/month = 6.59 failures/year<br />
f<br />
Calculate the total costs per failures per year TCP f (using Eq. 9)<br />
TCP = 6593 monetary units/year.<br />
f<br />
(15)<br />
(16)<br />
The equivalent annual total cost of 6593 monetary units represents the<br />
value of money that will be needed every year to pay for the problems caused<br />
by failures, during the 10 years of expected useful life;<br />
Calculate the total costs per failures in present value NPV(TCP f ) (using<br />
Eq. 10), for a period T=10 years and discount rate i=9%:<br />
10<br />
( 1+ 0.09)<br />
−1<br />
× ( + )<br />
NPV ( TCP f<br />
) = 6593 = 42631 monetary units.<br />
10<br />
0.09 1 0.09<br />
4. Conclusions<br />
(17)<br />
1. The Weibull distribution failure rate model could contribute to the<br />
enhancement of the specialized wheeled vehicle systems performances by<br />
diminishing the uncertainty within the process of total life cycle cost estimation.<br />
2. The calculus example emphasized the strong points and weak points of<br />
the presented method as follows:<br />
a) the obtained annual equivalent total cost, represent the mean value of<br />
money that will be needed every year to pay for the problems of failures, during<br />
the 10 years of expected useful life, with a discount factor of 9%. The frequency<br />
of failures varies every year throughout the expected cycle of useful life.<br />
b) in order to conduct an accurate assessment of the process of reliability<br />
it is necessary that the data gathering must be based on a detailed and good<br />
quality information about the more important types of failures and, if possible,<br />
for similar operational conditions.<br />
3. The main limitations of this method are:<br />
a) regardless the use of the Weibull distribution, the model quantifies the<br />
impact of the non-reliability annual costs in a constant way over the years of<br />
expected asset useful life;<br />
b) it restricts the reliability analysis to the exclusive use of the Weibull<br />
distribution, excluding other existent statistical distributions, which could also<br />
be used in the calculation of the MTBF and failure frequencies.


