Weather and Climate Extremes in a Changing Climate. Regions of ...
Weather and Climate Extremes in a Changing Climate. Regions of ...
Weather and Climate Extremes in a Changing Climate. Regions of ...
Create successful ePaper yourself
Turn your PDF publications into a flip-book with our unique Google optimized e-Paper software.
The U.S. <strong>Climate</strong> Change Science Program Chapter 3<br />
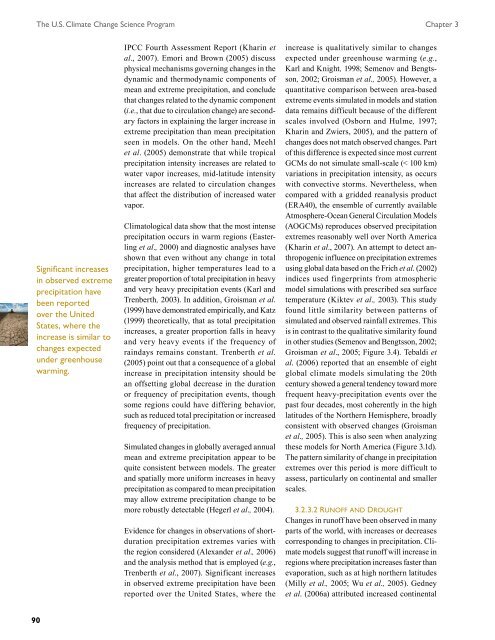
Significant <strong>in</strong>creases<br />
<strong>in</strong> observed extreme<br />
precipitation have<br />
been reported<br />
over the United<br />
States, where the<br />
<strong>in</strong>crease is similar to<br />
changes expected<br />
under greenhouse<br />
warm<strong>in</strong>g.<br />
90<br />
IPCC Fourth Assessment Report (Khar<strong>in</strong> et<br />
al., 2007). Emori <strong>and</strong> Brown (2005) discuss<br />
physical mechanisms govern<strong>in</strong>g changes <strong>in</strong> the<br />
dynamic <strong>and</strong> thermodynamic components <strong>of</strong><br />
mean <strong>and</strong> extreme precipitation, <strong>and</strong> conclude<br />
that changes related to the dynamic component<br />
(i.e., that due to circulation change) are secondary<br />
factors <strong>in</strong> expla<strong>in</strong><strong>in</strong>g the larger <strong>in</strong>crease <strong>in</strong><br />
extreme precipitation than mean precipitation<br />
seen <strong>in</strong> models. On the other h<strong>and</strong>, Meehl<br />
et al. (2005) demonstrate that while tropical<br />
precipitation <strong>in</strong>tensity <strong>in</strong>creases are related to<br />
water vapor <strong>in</strong>creases, mid-latitude <strong>in</strong>tensity<br />
<strong>in</strong>creases are related to circulation changes<br />
that affect the distribution <strong>of</strong> <strong>in</strong>creased water<br />
vapor.<br />
Climatological data show that the most <strong>in</strong>tense<br />
precipitation occurs <strong>in</strong> warm regions (Easterl<strong>in</strong>g<br />
et al., 2000) <strong>and</strong> diagnostic analyses have<br />
shown that even without any change <strong>in</strong> total<br />
precipitation, higher temperatures lead to a<br />
greater proportion <strong>of</strong> total precipitation <strong>in</strong> heavy<br />
<strong>and</strong> very heavy precipitation events (Karl <strong>and</strong><br />
Trenberth, 2003). In addition, Groisman et al.<br />
(1999) have demonstrated empirically, <strong>and</strong> Katz<br />
(1999) theoretically, that as total precipitation<br />
<strong>in</strong>creases, a greater proportion falls <strong>in</strong> heavy<br />
<strong>and</strong> very heavy events if the frequency <strong>of</strong><br />
ra<strong>in</strong>days rema<strong>in</strong>s constant. Trenberth et al.<br />
(2005) po<strong>in</strong>t out that a consequence <strong>of</strong> a global<br />
<strong>in</strong>crease <strong>in</strong> precipitation <strong>in</strong>tensity should be<br />
an <strong>of</strong>fsett<strong>in</strong>g global decrease <strong>in</strong> the duration<br />
or frequency <strong>of</strong> precipitation events, though<br />
some regions could have differ<strong>in</strong>g behavior,<br />
such as reduced total precipitation or <strong>in</strong>creased<br />
frequency <strong>of</strong> precipitation.<br />
Simulated changes <strong>in</strong> globally averaged annual<br />
mean <strong>and</strong> extreme precipitation appear to be<br />
quite consistent between models. The greater<br />
<strong>and</strong> spatially more uniform <strong>in</strong>creases <strong>in</strong> heavy<br />
precipitation as compared to mean precipitation<br />
may allow extreme precipitation change to be<br />
more robustly detectable (Hegerl et al., 2004).<br />
Evidence for changes <strong>in</strong> observations <strong>of</strong> shortduration<br />
precipitation extremes varies with<br />
the region considered (Alex<strong>and</strong>er et al., 2006)<br />
<strong>and</strong> the analysis method that is employed (e.g.,<br />
Trenberth et al., 2007). Significant <strong>in</strong>creases<br />
<strong>in</strong> observed extreme precipitation have been<br />
reported over the United States, where the<br />
<strong>in</strong>crease is qualitatively similar to changes<br />
expected under greenhouse warm<strong>in</strong>g (e.g.,<br />
Karl <strong>and</strong> Knight, 1998; Semenov <strong>and</strong> Bengtsson,<br />
2002; Groisman et al., 2005). However, a<br />
quantitative comparison between area-based<br />
extreme events simulated <strong>in</strong> models <strong>and</strong> station<br />
data rema<strong>in</strong>s difficult because <strong>of</strong> the different<br />
scales <strong>in</strong>volved (Osborn <strong>and</strong> Hulme, 1997;<br />
Khar<strong>in</strong> <strong>and</strong> Zwiers, 2005), <strong>and</strong> the pattern <strong>of</strong><br />
changes does not match observed changes. Part<br />
<strong>of</strong> this difference is expected s<strong>in</strong>ce most current<br />
GCMs do not simulate small-scale (< 100 km)<br />
variations <strong>in</strong> precipitation <strong>in</strong>tensity, as occurs<br />
with convective storms. Nevertheless, when<br />
compared with a gridded reanalysis product<br />
(ERA40), the ensemble <strong>of</strong> currently available<br />
Atmosphere-Ocean General Circulation Models<br />
(AOGCMs) reproduces observed precipitation<br />
extremes reasonably well over North America<br />
(Khar<strong>in</strong> et al., 2007). An attempt to detect anthropogenic<br />
<strong>in</strong>fluence on precipitation extremes<br />
us<strong>in</strong>g global data based on the Frich et al. (2002)<br />
<strong>in</strong>dices used f<strong>in</strong>gerpr<strong>in</strong>ts from atmospheric<br />
model simulations with prescribed sea surface<br />
temperature (Kiktev et al., 2003). This study<br />
found little similarity between patterns <strong>of</strong><br />
simulated <strong>and</strong> observed ra<strong>in</strong>fall extremes. This<br />
is <strong>in</strong> contrast to the qualitative similarity found<br />
<strong>in</strong> other studies (Semenov <strong>and</strong> Bengtsson, 2002;<br />
Groisman et al., 2005; Figure 3.4). Tebaldi et<br />
al. (2006) reported that an ensemble <strong>of</strong> eight<br />
global climate models simulat<strong>in</strong>g the 20th<br />
century showed a general tendency toward more<br />
frequent heavy-precipitation events over the<br />
past four decades, most coherently <strong>in</strong> the high<br />
latitudes <strong>of</strong> the Northern Hemisphere, broadly<br />
consistent with observed changes (Groisman<br />
et al., 2005). This is also seen when analyz<strong>in</strong>g<br />
these models for North America (Figure 3.1d).<br />
The pattern similarity <strong>of</strong> change <strong>in</strong> precipitation<br />
extremes over this period is more difficult to<br />
assess, particularly on cont<strong>in</strong>ental <strong>and</strong> smaller<br />
scales.<br />
3.2.3.2 runOff <strong>and</strong> drOught<br />
Changes <strong>in</strong> run<strong>of</strong>f have been observed <strong>in</strong> many<br />
parts <strong>of</strong> the world, with <strong>in</strong>creases or decreases<br />
correspond<strong>in</strong>g to changes <strong>in</strong> precipitation. <strong>Climate</strong><br />
models suggest that run<strong>of</strong>f will <strong>in</strong>crease <strong>in</strong><br />
regions where precipitation <strong>in</strong>creases faster than<br />
evaporation, such as at high northern latitudes<br />
(Milly et al., 2005; Wu et al., 2005). Gedney<br />
et al. (2006a) attributed <strong>in</strong>creased cont<strong>in</strong>ental


