Weather and Climate Extremes in a Changing Climate. Regions of ...
Weather and Climate Extremes in a Changing Climate. Regions of ...
Weather and Climate Extremes in a Changing Climate. Regions of ...

Create successful ePaper yourself
Turn your PDF publications into a flip-book with our unique Google optimized e-Paper software.
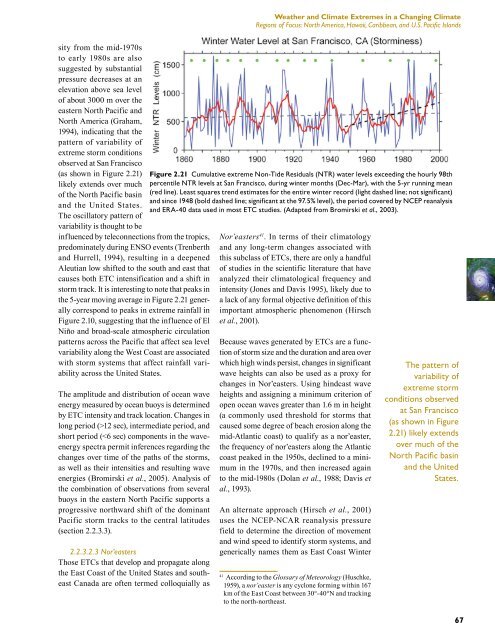
sity from the mid-1970s<br />
to early 1980s are also<br />
suggested by substantial<br />
pressure decreases at an<br />
elevation above sea level<br />
<strong>of</strong> about 3000 m over the<br />
eastern North Pacific <strong>and</strong><br />
North America (Graham,<br />
1994), <strong>in</strong>dicat<strong>in</strong>g that the<br />
pattern <strong>of</strong> variability <strong>of</strong><br />
extreme storm conditions<br />
observed at San Francisco<br />
(as shown <strong>in</strong> Figure 2.21)<br />
likely extends over much<br />
<strong>of</strong> the North Pacific bas<strong>in</strong><br />
<strong>and</strong> the United States.<br />
The oscillatory pattern <strong>of</strong><br />
variability is thought to be<br />
<strong>in</strong>fluenced by teleconnections from the tropics,<br />
predom<strong>in</strong>ately dur<strong>in</strong>g ENSO events (Trenberth<br />
<strong>and</strong> Hurrell, 1994), result<strong>in</strong>g <strong>in</strong> a deepened<br />
Aleutian low shifted to the south <strong>and</strong> east that<br />
causes both ETC <strong>in</strong>tensification <strong>and</strong> a shift <strong>in</strong><br />
storm track. It is <strong>in</strong>terest<strong>in</strong>g to note that peaks <strong>in</strong><br />
the 5-year mov<strong>in</strong>g average <strong>in</strong> Figure 2.21 generally<br />
correspond to peaks <strong>in</strong> extreme ra<strong>in</strong>fall <strong>in</strong><br />
Figure 2.10, suggest<strong>in</strong>g that the <strong>in</strong>fluence <strong>of</strong> El<br />
Niño <strong>and</strong> broad-scale atmospheric circulation<br />
patterns across the Pacific that affect sea level<br />
variability along the West Coast are associated<br />
with storm systems that affect ra<strong>in</strong>fall variability<br />
across the United States.<br />
The amplitude <strong>and</strong> distribution <strong>of</strong> ocean wave<br />
energy measured by ocean buoys is determ<strong>in</strong>ed<br />
by ETC <strong>in</strong>tensity <strong>and</strong> track location. Changes <strong>in</strong><br />
long period (>12 sec), <strong>in</strong>termediate period, <strong>and</strong><br />
short period (