Weather and Climate Extremes in a Changing Climate. Regions of ...
Weather and Climate Extremes in a Changing Climate. Regions of ...
Weather and Climate Extremes in a Changing Climate. Regions of ...

You also want an ePaper? Increase the reach of your titles
YUMPU automatically turns print PDFs into web optimized ePapers that Google loves.
The U.S. <strong>Climate</strong> Change Science Program Chapter 2<br />
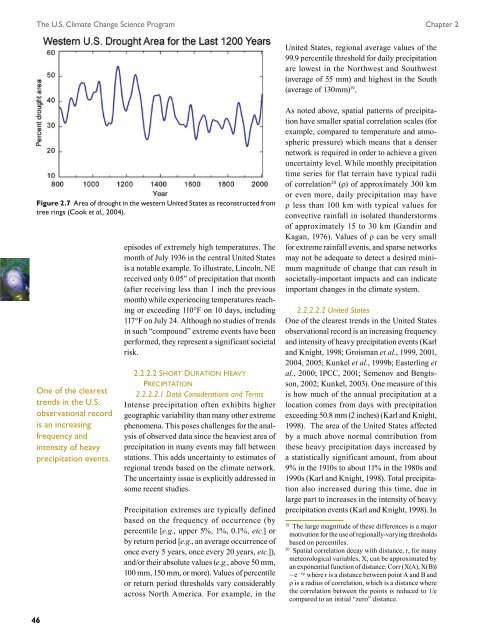
Figure 2.7 Area <strong>of</strong> drought <strong>in</strong> the western United States as reconstructed from<br />
tree r<strong>in</strong>gs (Cook et al., 2004).<br />
One <strong>of</strong> the clearest<br />
trends <strong>in</strong> the U.S.<br />
observational record<br />
is an <strong>in</strong>creas<strong>in</strong>g<br />
frequency <strong>and</strong><br />
<strong>in</strong>tensity <strong>of</strong> heavy<br />
precipitation events.<br />
46<br />
episodes <strong>of</strong> extremely high temperatures. The<br />
month <strong>of</strong> July 1936 <strong>in</strong> the central United States<br />
is a notable example. To illustrate, L<strong>in</strong>coln, NE<br />
received only 0.05” <strong>of</strong> precipitation that month<br />
(after receiv<strong>in</strong>g less than 1 <strong>in</strong>ch the previous<br />
month) while experienc<strong>in</strong>g temperatures reach<strong>in</strong>g<br />
or exceed<strong>in</strong>g 110°F on 10 days, <strong>in</strong>clud<strong>in</strong>g<br />
117°F on July 24. Although no studies <strong>of</strong> trends<br />
<strong>in</strong> such “compound” extreme events have been<br />
performed, they represent a significant societal<br />
risk.<br />
2.2.2.2 shOrt dur atiOn heav y<br />
PreCiPitatiOn<br />
2.2.2.2.1 Data Considerations <strong>and</strong> Terms<br />
Intense precipitation <strong>of</strong>ten exhibits higher<br />
geographic variability than many other extreme<br />
phenomena. This poses challenges for the analysis<br />
<strong>of</strong> observed data s<strong>in</strong>ce the heaviest area <strong>of</strong><br />
precipitation <strong>in</strong> many events may fall between<br />
stations. This adds uncerta<strong>in</strong>ty to estimates <strong>of</strong><br />
regional trends based on the climate network.<br />
The uncerta<strong>in</strong>ty issue is explicitly addressed <strong>in</strong><br />
some recent studies.<br />
Precipitation extremes are typically def<strong>in</strong>ed<br />
based on the frequency <strong>of</strong> occurrence (by<br />
percentile [e.g., upper 5%, 1%, 0.1%, etc.] or<br />
by return period [e.g., an average occurrence <strong>of</strong><br />
once every 5 years, once every 20 years, etc.]),<br />
<strong>and</strong>/or their absolute values (e.g., above 50 mm,<br />
100 mm, 150 mm, or more). Values <strong>of</strong> percentile<br />
or return period thresholds vary considerably<br />
across North America. For example, <strong>in</strong> the<br />
United States, regional average values <strong>of</strong> the<br />
99.9 percentile threshold for daily precipitation<br />
are lowest <strong>in</strong> the Northwest <strong>and</strong> Southwest<br />
(average <strong>of</strong> 55 mm) <strong>and</strong> highest <strong>in</strong> the South<br />
(average <strong>of</strong> 130mm) 19 .<br />
As noted above, spatial patterns <strong>of</strong> precipitation<br />
have smaller spatial correlation scales (for<br />
example, compared to temperature <strong>and</strong> atmospheric<br />
pressure) which means that a denser<br />
network is required <strong>in</strong> order to achieve a given<br />
uncerta<strong>in</strong>ty level. While monthly precipitation<br />
time series for flat terra<strong>in</strong> have typical radii<br />
<strong>of</strong> correlation 20 (ρ) <strong>of</strong> approximately 300 km<br />
or even more, daily precipitation may have<br />
ρ less than 100 km with typical values for<br />
convective ra<strong>in</strong>fall <strong>in</strong> isolated thunderstorms<br />
<strong>of</strong> approximately 15 to 30 km (G<strong>and</strong><strong>in</strong> <strong>and</strong><br />
Kagan, 1976). Values <strong>of</strong> ρ can be very small<br />
for extreme ra<strong>in</strong>fall events, <strong>and</strong> sparse networks<br />
may not be adequate to detect a desired m<strong>in</strong>imum<br />
magnitude <strong>of</strong> change that can result <strong>in</strong><br />
societally-important impacts <strong>and</strong> can <strong>in</strong>dicate<br />
important changes <strong>in</strong> the climate system.<br />
2.2.2.2.2 United States<br />
One <strong>of</strong> the clearest trends <strong>in</strong> the United States<br />
observational record is an <strong>in</strong>creas<strong>in</strong>g frequency<br />
<strong>and</strong> <strong>in</strong>tensity <strong>of</strong> heavy precipitation events (Karl<br />
<strong>and</strong> Knight, 1998; Groisman et al., 1999, 2001,<br />
2004, 2005; Kunkel et al., 1999b; Easterl<strong>in</strong>g et<br />
al., 2000; IPCC, 2001; Semenov <strong>and</strong> Bengtsson,<br />
2002; Kunkel, 2003). One measure <strong>of</strong> this<br />
is how much <strong>of</strong> the annual precipitation at a<br />
location comes from days with precipitation<br />
exceed<strong>in</strong>g 50.8 mm (2 <strong>in</strong>ches) (Karl <strong>and</strong> Knight,<br />
1998). The area <strong>of</strong> the United States affected<br />
by a much above normal contribution from<br />
these heavy precipitation days <strong>in</strong>creased by<br />
a statistically significant amount, from about<br />
9% <strong>in</strong> the 1910s to about 11% <strong>in</strong> the 1980s <strong>and</strong><br />
1990s (Karl <strong>and</strong> Knight, 1998). Total precipitation<br />
also <strong>in</strong>creased dur<strong>in</strong>g this time, due <strong>in</strong><br />
large part to <strong>in</strong>creases <strong>in</strong> the <strong>in</strong>tensity <strong>of</strong> heavy<br />
precipitation events (Karl <strong>and</strong> Knight, 1998). In<br />
19 The large magnitude <strong>of</strong> these differences is a major<br />
motivation for the use <strong>of</strong> regionally-vary<strong>in</strong>g thresholds<br />
based on percentiles.<br />
20 Spatial correlation decay with distance, r, for many<br />
meteorological variables, X, can be approximated by<br />
an exponential function <strong>of</strong> distance: Corr (X(A), X(B))<br />
~ e - r/ρ where r is a distance between po<strong>in</strong>t A <strong>and</strong> B <strong>and</strong><br />
ρ is a radius <strong>of</strong> correlation, which is a distance where<br />
the correlation between the po<strong>in</strong>ts is reduced to 1/e<br />
compared to an <strong>in</strong>itial “zero” distance.