Weather and Climate Extremes in a Changing Climate. Regions of ...
Weather and Climate Extremes in a Changing Climate. Regions of ...
Weather and Climate Extremes in a Changing Climate. Regions of ...

You also want an ePaper? Increase the reach of your titles
YUMPU automatically turns print PDFs into web optimized ePapers that Google loves.
The U.S. <strong>Climate</strong> Change Science Program Chapter 2<br />
For the U.S. as a<br />
whole, the average<br />
length <strong>of</strong> the frostfree<br />
season over the<br />
1895-2000 period<br />
<strong>in</strong>creased by almost<br />
two weeks.<br />
40<br />
pattern <strong>of</strong> hot summers dur<strong>in</strong>g 1995-2003 was<br />
similar to that <strong>of</strong> the 1930s (Gershunov <strong>and</strong><br />
Douville, 2008).<br />
The occurrence <strong>of</strong> temperatures below the<br />
biologically <strong>and</strong> societally important freez<strong>in</strong>g<br />
threshold (0°C, 32°F) is an important aspect <strong>of</strong><br />
the cold season climatology. Studies have typically<br />
characterized this either <strong>in</strong> terms <strong>of</strong> the<br />
number <strong>of</strong> frost days (days with the m<strong>in</strong>imum<br />
temperature below freez<strong>in</strong>g) or the length <strong>of</strong><br />
the frost-free season 13 . The number <strong>of</strong> frost<br />
days decreased by four days per year <strong>in</strong> the<br />
United States dur<strong>in</strong>g the 1948-1999 period, with<br />
the largest decreases, as many as 13 days per<br />
year, occurr<strong>in</strong>g <strong>in</strong> the western United States 14<br />
(Easterl<strong>in</strong>g, 2002). In Canada, there have been<br />
significant decreases <strong>in</strong> frost day occurrence<br />
over the entire country from 1950 to 2003,<br />
with the largest decreases <strong>in</strong> extreme western<br />
Canada where there have been decreases <strong>of</strong> up<br />
to 40 or more frost days per year, <strong>and</strong> slightly<br />
smaller decreases <strong>in</strong> eastern Canada (V<strong>in</strong>cent<br />
<strong>and</strong> Mekis, 2006). The start <strong>of</strong> the frost-free<br />
season <strong>in</strong> the northeastern United States occurred<br />
11 days earlier <strong>in</strong> the 1990s than <strong>in</strong> the<br />
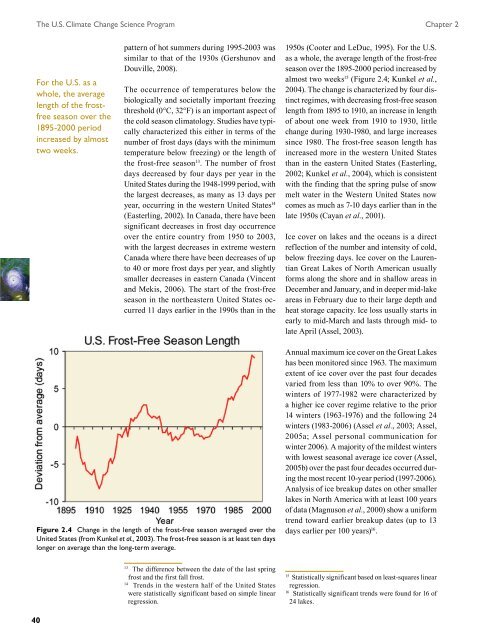
Figure 2.4 Change <strong>in</strong> the length <strong>of</strong> the frost-free season averaged over the<br />
United States (from Kunkel et al., 2003). The frost-free season is at least ten days<br />
longer on average than the long-term average.<br />
13 The difference between the date <strong>of</strong> the last spr<strong>in</strong>g<br />
frost <strong>and</strong> the first fall frost.<br />
14 Trends <strong>in</strong> the western half <strong>of</strong> the United States<br />
were statistically significant based on simple l<strong>in</strong>ear<br />
regression.<br />
1950s (Cooter <strong>and</strong> LeDuc, 1995). For the U.S.<br />
as a whole, the average length <strong>of</strong> the frost-free<br />
season over the 1895-2000 period <strong>in</strong>creased by<br />
almost two weeks 15 (Figure 2.4; Kunkel et al.,<br />
2004). The change is characterized by four dist<strong>in</strong>ct<br />
regimes, with decreas<strong>in</strong>g frost-free season<br />
length from 1895 to 1910, an <strong>in</strong>crease <strong>in</strong> length<br />
<strong>of</strong> about one week from 1910 to 1930, little<br />
change dur<strong>in</strong>g 1930-1980, <strong>and</strong> large <strong>in</strong>creases<br />
s<strong>in</strong>ce 1980. The frost-free season length has<br />
<strong>in</strong>creased more <strong>in</strong> the western United States<br />
than <strong>in</strong> the eastern United States (Easterl<strong>in</strong>g,<br />
2002; Kunkel et al., 2004), which is consistent<br />
with the f<strong>in</strong>d<strong>in</strong>g that the spr<strong>in</strong>g pulse <strong>of</strong> snow<br />
melt water <strong>in</strong> the Western United States now<br />
comes as much as 7-10 days earlier than <strong>in</strong> the<br />
late 1950s (Cayan et al., 2001).<br />
Ice cover on lakes <strong>and</strong> the oceans is a direct<br />
reflection <strong>of</strong> the number <strong>and</strong> <strong>in</strong>tensity <strong>of</strong> cold,<br />
below freez<strong>in</strong>g days. Ice cover on the Laurentian<br />
Great Lakes <strong>of</strong> North American usually<br />
forms along the shore <strong>and</strong> <strong>in</strong> shallow areas <strong>in</strong><br />
December <strong>and</strong> January, <strong>and</strong> <strong>in</strong> deeper mid-lake<br />
areas <strong>in</strong> February due to their large depth <strong>and</strong><br />
heat storage capacity. Ice loss usually starts <strong>in</strong><br />
early to mid-March <strong>and</strong> lasts through mid- to<br />
late April (Assel, 2003).<br />
Annual maximum ice cover on the Great Lakes<br />
has been monitored s<strong>in</strong>ce 1963. The maximum<br />
extent <strong>of</strong> ice cover over the past four decades<br />
varied from less than 10% to over 90%. The<br />
w<strong>in</strong>ters <strong>of</strong> 1977-1982 were characterized by<br />
a higher ice cover regime relative to the prior<br />
14 w<strong>in</strong>ters (1963-1976) <strong>and</strong> the follow<strong>in</strong>g 24<br />
w<strong>in</strong>ters (1983-2006) (Assel et al., 2003; Assel,<br />
2005a; Assel personal communication for<br />
w<strong>in</strong>ter 2006). A majority <strong>of</strong> the mildest w<strong>in</strong>ters<br />
with lowest seasonal average ice cover (Assel,<br />
2005b) over the past four decades occurred dur<strong>in</strong>g<br />
the most recent 10-year period (1997-2006).<br />
Analysis <strong>of</strong> ice breakup dates on other smaller<br />
lakes <strong>in</strong> North America with at least 100 years<br />
<strong>of</strong> data (Magnuson et al., 2000) show a uniform<br />
trend toward earlier breakup dates (up to 13<br />
days earlier per 100 years) 16 .<br />
15 Statistically significant based on least-squares l<strong>in</strong>ear<br />
regression.<br />
16 Statistically significant trends were found for 16 <strong>of</strong><br />
24 lakes.