Weather and Climate Extremes in a Changing Climate. Regions of ...
Weather and Climate Extremes in a Changing Climate. Regions of ...
Weather and Climate Extremes in a Changing Climate. Regions of ...

Create successful ePaper yourself
Turn your PDF publications into a flip-book with our unique Google optimized e-Paper software.
The U.S. <strong>Climate</strong> Change Science Program Chapter 2<br />
It is likely that<br />
hurricane activity,<br />
as measured by the<br />
Power Dissipation<br />
Index, has <strong>in</strong>creased<br />
substantially s<strong>in</strong>ce<br />
the 1950s <strong>and</strong><br />
‘60s <strong>in</strong> association<br />
with warmer<br />
Atlantic sea surface<br />
temperatures.<br />
56<br />
both variability <strong>and</strong> trends between their new<br />
record <strong>and</strong> the best track data <strong>in</strong> the North<br />
Atlantic <strong>and</strong> Eastern Pacific bas<strong>in</strong>s dur<strong>in</strong>g the<br />
period 1983–2005. They concluded that the<br />
best track ma<strong>in</strong>ta<strong>in</strong>ed by the NHC does not<br />
appear to suffer from data quality issues dur<strong>in</strong>g<br />
this period. On the other h<strong>and</strong>, they were<br />
not able to corroborate the presence <strong>of</strong> upward<br />
<strong>in</strong>tensity trends <strong>in</strong> any <strong>of</strong> the rema<strong>in</strong><strong>in</strong>g tropical<br />
cyclone-prone ocean bas<strong>in</strong>s. This could be due<br />
to <strong>in</strong>accuracies <strong>in</strong> the satellite best tracks, or<br />
could be due to the tra<strong>in</strong><strong>in</strong>g <strong>of</strong> the Koss<strong>in</strong> et al.<br />
technique on North Atlantic data. The results<br />
<strong>of</strong> Koss<strong>in</strong> et al. (2007a) are supported by Wu<br />
et al. (2006), who considered Western Pacific<br />
best track data constructed by other agencies<br />
(HKMO <strong>and</strong> JMA) that construct best track<br />
data for the western North Pacific. Harper<br />
<strong>and</strong> Callaghan (2006) report on reanalyzed<br />
data from the Southeastern Indian Ocean <strong>and</strong><br />
showed some biases, but an upward <strong>in</strong>tensity<br />
trend rema<strong>in</strong>s. These studies underscores the<br />
need for improved care <strong>in</strong> analyz<strong>in</strong>g tropical<br />
cyclones <strong>and</strong> <strong>in</strong> obta<strong>in</strong><strong>in</strong>g better underst<strong>and</strong><strong>in</strong>g<br />
<strong>of</strong> the climatic controls <strong>of</strong> tropical cyclone activity<br />
beyond SST-based arguments alone.<br />
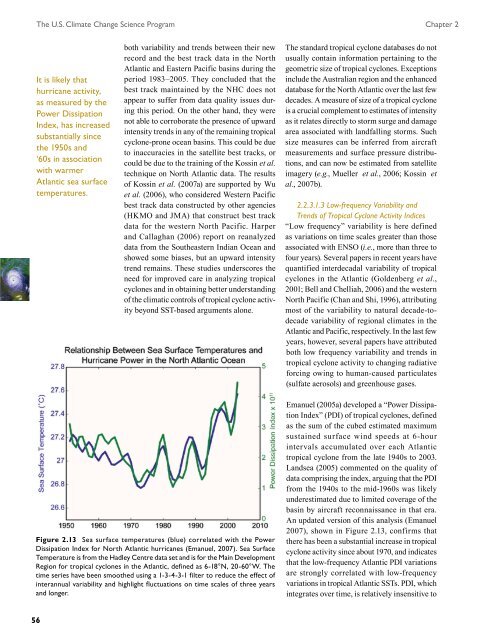
Figure 2.13 Sea surface temperatures (blue) correlated with the Power<br />
Dissipation Index for North Atlantic hurricanes (Emanuel, 2007). Sea Surface<br />
Temperature is from the Hadley Centre data set <strong>and</strong> is for the Ma<strong>in</strong> Development<br />
Region for tropical cyclones <strong>in</strong> the Atlantic, def<strong>in</strong>ed as 6-18°N, 20-60°W. The<br />
time series have been smoothed us<strong>in</strong>g a 1-3-4-3-1 filter to reduce the effect <strong>of</strong><br />
<strong>in</strong>terannual variability <strong>and</strong> highlight fluctuations on time scales <strong>of</strong> three years<br />
<strong>and</strong> longer.<br />
The st<strong>and</strong>ard tropical cyclone databases do not<br />
usually conta<strong>in</strong> <strong>in</strong>formation perta<strong>in</strong><strong>in</strong>g to the<br />
geometric size <strong>of</strong> tropical cyclones. Exceptions<br />
<strong>in</strong>clude the Australian region <strong>and</strong> the enhanced<br />
database for the North Atlantic over the last few<br />
decades. A measure <strong>of</strong> size <strong>of</strong> a tropical cyclone<br />
is a crucial complement to estimates <strong>of</strong> <strong>in</strong>tensity<br />
as it relates directly to storm surge <strong>and</strong> damage<br />
area associated with l<strong>and</strong>fall<strong>in</strong>g storms. Such<br />
size measures can be <strong>in</strong>ferred from aircraft<br />
measurements <strong>and</strong> surface pressure distributions,<br />
<strong>and</strong> can now be estimated from satellite<br />
imagery (e.g., Mueller et al., 2006; Koss<strong>in</strong> et<br />
al., 2007b).<br />
2.2.3.1.3 Low-frequency Variability <strong>and</strong><br />
Trends <strong>of</strong> Tropical Cyclone Activity Indices<br />
“Low frequency” variability is here def<strong>in</strong>ed<br />
as variations on time scales greater than those<br />
associated with ENSO (i.e., more than three to<br />
four years). Several papers <strong>in</strong> recent years have<br />
quantified <strong>in</strong>terdecadal variability <strong>of</strong> tropical<br />
cyclones <strong>in</strong> the Atlantic (Goldenberg et al.,<br />
2001; Bell <strong>and</strong> Chelliah, 2006) <strong>and</strong> the western<br />
North Pacific (Chan <strong>and</strong> Shi, 1996), attribut<strong>in</strong>g<br />
most <strong>of</strong> the variability to natural decade-todecade<br />
variability <strong>of</strong> regional climates <strong>in</strong> the<br />
Atlantic <strong>and</strong> Pacific, respectively. In the last few<br />
years, however, several papers have attributed<br />
both low frequency variability <strong>and</strong> trends <strong>in</strong><br />
tropical cyclone activity to chang<strong>in</strong>g radiative<br />
forc<strong>in</strong>g ow<strong>in</strong>g to human-caused particulates<br />
(sulfate aerosols) <strong>and</strong> greenhouse gases.<br />
Emanuel (2005a) developed a “Power Dissipation<br />
Index” (PDI) <strong>of</strong> tropical cyclones, def<strong>in</strong>ed<br />
as the sum <strong>of</strong> the cubed estimated maximum<br />
susta<strong>in</strong>ed surface w<strong>in</strong>d speeds at 6-hour<br />
<strong>in</strong>tervals accumulated over each Atlantic<br />
tropical cyclone from the late 1940s to 2003.<br />
L<strong>and</strong>sea (2005) commented on the quality <strong>of</strong><br />
data compris<strong>in</strong>g the <strong>in</strong>dex, argu<strong>in</strong>g that the PDI<br />
from the 1940s to the mid-1960s was likely<br />
underestimated due to limited coverage <strong>of</strong> the<br />
bas<strong>in</strong> by aircraft reconnaissance <strong>in</strong> that era.<br />
An updated version <strong>of</strong> this analysis (Emanuel<br />
2007), shown <strong>in</strong> Figure 2.13, confirms that<br />
there has been a substantial <strong>in</strong>crease <strong>in</strong> tropical<br />
cyclone activity s<strong>in</strong>ce about 1970, <strong>and</strong> <strong>in</strong>dicates<br />
that the low-frequency Atlantic PDI variations<br />
are strongly correlated with low-frequency<br />
variations <strong>in</strong> tropical Atlantic SSTs. PDI, which<br />
<strong>in</strong>tegrates over time, is relatively <strong>in</strong>sensitive to