Part 1 – A Rapid Participatory Biodiversity Assessment - IUCN
Part 1 – A Rapid Participatory Biodiversity Assessment - IUCN
Part 1 – A Rapid Participatory Biodiversity Assessment - IUCN

Create successful ePaper yourself
Turn your PDF publications into a flip-book with our unique Google optimized e-Paper software.
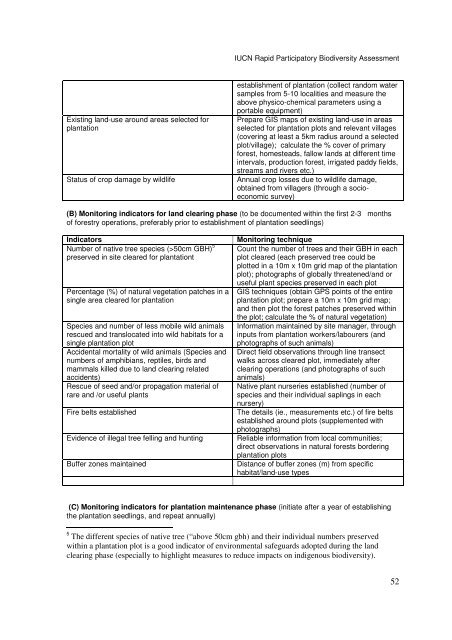
Existing land-use around areas selected for<br />
plantation<br />
<strong>IUCN</strong> <strong>Rapid</strong> <strong>Part</strong>icipatory <strong>Biodiversity</strong> <strong>Assessment</strong><br />
establishment of plantation (collect random water<br />
samples from 5-10 localities and measure the<br />
above physico-chemical parameters using a<br />
portable equipment)<br />
Prepare GIS maps of existing land-use in areas<br />
selected for plantation plots and relevant villages<br />
(covering at least a 5km radius around a selected<br />
plot/village); calculate the % cover of primary<br />
forest, homesteads, fallow lands at different time<br />
intervals, production forest, irrigated paddy fields,<br />
streams and rivers etc.)<br />
Status of crop damage by wildlife Annual crop losses due to wildlife damage,<br />
obtained from villagers (through a socioeconomic<br />
survey)<br />
(B) Monitoring indicators for land clearing phase (to be documented within the first 2-3 months<br />
of forestry operations, preferably prior to establishment of plantation seedlings)<br />
Indicators Monitoring technique<br />
Number of native tree species (>50cm GBH) 5<br />
preserved in site cleared for plantationt<br />
Percentage (%) of natural vegetation patches in a<br />
single area cleared for plantation<br />
Species and number of less mobile wild animals<br />
rescued and translocated into wild habitats for a<br />
single plantation plot<br />
Accidental mortality of wild animals (Species and<br />
numbers of amphibians, reptiles, birds and<br />
mammals killed due to land clearing related<br />
accidents)<br />
Rescue of seed and/or propagation material of<br />
rare and /or useful plants<br />
Count the number of trees and their GBH in each<br />
plot cleared (each preserved tree could be<br />
plotted in a 10m x 10m grid map of the plantation<br />
plot); photographs of globally threatened/and or<br />
useful plant species preserved in each plot<br />
GIS techniques (obtain GPS points of the entire<br />
plantation plot; prepare a 10m x 10m grid map;<br />
and then plot the forest patches preserved within<br />
the plot; calculate the % of natural vegetation)<br />
Information maintained by site manager, through<br />
inputs from plantation workers/labourers (and<br />
photographs of such animals)<br />
Direct field observations through line transect<br />
walks across cleared plot, immediately after<br />
clearing operations (and photographs of such<br />
animals)<br />
Native plant nurseries established (number of<br />
species and their individual saplings in each<br />
nursery)<br />
Fire belts established The details (ie., measurements etc.) of fire belts<br />
established around plots (supplemented with<br />
photographs)<br />
Evidence of illegal tree felling and hunting Reliable information from local communities;<br />
direct observations in natural forests bordering<br />
plantation plots<br />
Buffer zones maintained Distance of buffer zones (m) from specific<br />
habitat/land-use types<br />
(C) Monitoring indicators for plantation maintenance phase (initiate after a year of establishing<br />
the plantation seedlings, and repeat annually)<br />
5 The different species of native tree (“above 50cm gbh) and their individual numbers preserved<br />
within a plantation plot is a good indicator of environmental safeguards adopted during the land<br />
clearing phase (especially to highlight measures to reduce impacts on indigenous biodiversity).<br />
52