Annual Report 2011 - Kongsberg Maritime - Kongsberg Gruppen
Annual Report 2011 - Kongsberg Maritime - Kongsberg Gruppen
Annual Report 2011 - Kongsberg Maritime - Kongsberg Gruppen
Create successful ePaper yourself
Turn your PDF publications into a flip-book with our unique Google optimized e-Paper software.
2 INTRODUCTION<br />
7 DIRECTORS’ REPORT AND<br />
18 FINANCIAL STATEMENTS<br />
64 CORPORATE GOVERNANCE<br />
76 FINANCIAL CALENDAR AND ADDRESSES<br />
46 KONGSBERG <strong>Annual</strong> <strong>Report</strong> <strong>2011</strong><br />
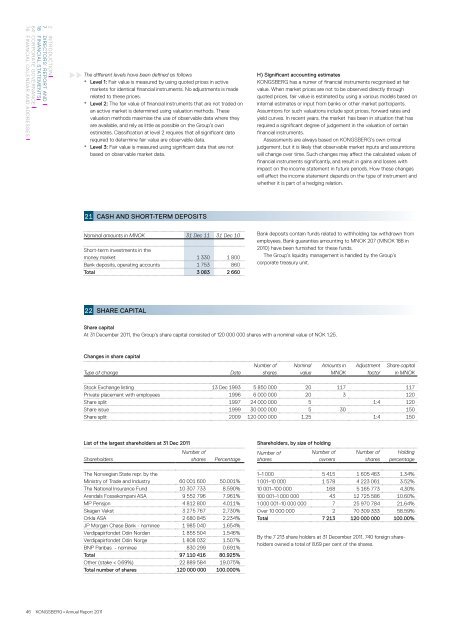
The different levels have been defined as follows<br />
* Level 1: Fair value is measured by using quoted prices in active<br />
markets for identical financial instruments. No adjustments is made<br />
related to these prices.<br />
* Level 2: The fair value of financial instruments that are not traded on<br />
an active market is determined using valuation methods. These<br />
valuation methods maximise the use of observable data where they<br />
are available, and rely as little as possible on the Group’s own<br />
estimates. Classification at level 2 requires that all significant data<br />
required to determine fair value are observable data.<br />
* Level 3: Fair value is measured using significant data that are not<br />
based on observable market data.<br />
21<br />
22<br />
CASH AND SHORT-TERM DEPOSITS<br />
Nominal amounts in MNOK 31 Dec 11 31 Dec 10<br />
Short-term investments in the<br />
money market 1 330 1 800<br />
Bank deposits, operating accounts 1 753 860<br />
Total 3 083 2 660<br />
SHARE CAPITAL<br />
List of the largest shareholders at 31 Dec <strong>2011</strong><br />
Number of<br />
Shareholders<br />
shares Percentage<br />
The Norwegian State repr. by the<br />
Ministry of Trade and Industry 60 001 600 50.001%<br />
The National Insurance Fund 10 307 733 8.590%<br />
Arendals Fossekompani ASA 9 552 796 7.961%<br />
MP Pensjon 4 812 800 4.011%<br />
Skagen Vekst 3 275 767 2.730%<br />
Orkla ASA 2 680 845 2.234%<br />
JP Morgan Chase Bank - nominee 1 985 040 1.654%<br />
Verdipapirfondet Odin Norden 1 855 504 1.546%<br />
Verdipapirfondet Odin Norge 1 808 032 1.507%<br />
BNP Paribas - nominee 830 299 0.691%<br />
Total 97 110 416 80.925%<br />
Other (stake < 0.69%) 22 889 584 19.075%<br />
Total number of shares 120 000 000 100.000%<br />
H) Significant accounting estimates<br />
KONGSBERG has a numer of financial instruments recgonised at fair<br />
value. When market prices are not to be observed directly through<br />
quoted prices, fair value is estimated by using a various models based on<br />
internal estimates or input from banks or other market participants.<br />
Assumtions for such valuations include spot prices, forward rates and<br />
yield curves. In recent years, the market has been in situation that has<br />
required a significant degree of judgement in the valuation of certain<br />
financial instruments.<br />
Assessments are always based on KONGSBERG’s own critical<br />
judgement, but it is likely that observable market inputs and assumtions<br />
will change over time. Such changes may affect the calculated values of<br />
financial instruments significantly, and result in gains and losses with<br />
impact on the income statement in future periods. How these changes<br />
will affect the income statement depends on the type of instrument and<br />
whether it is part of a hedging relation.<br />
Bank deposits contain funds related to withholding tax withdrawn from<br />
employees. Bank guaranties amounting to MNOK 207 (MNOK 188 in<br />
2010) have been furnished for these funds.<br />
The Group’s liquidity management is handled by the Group’s<br />
corporate treasury unit.<br />
Share capital<br />
At 31 December <strong>2011</strong>, the Group’s share capital consisted of 120 000 000 shares with a nominal value of NOK 1.25.<br />
Changes in share capital<br />
Type of change Date<br />
Number of<br />
shares<br />
Shareholders, by size of holding<br />
Number of<br />
shares<br />
Nominal<br />
value<br />
Amounts in<br />
MNOK<br />
Number of<br />
owners<br />
Adjustment<br />
factor<br />
Number of<br />
shares<br />
Share capital<br />
in MNOK<br />
Stock Exchange listing 13 Dec 1993 5 850 000 20 117 117<br />
Private placement with employees 1996 6 000 000 20 3 120<br />
Share split 1997 24 000 000 5 1:4 120<br />
Share issue 1999 30 000 000 5 30 150<br />
Share split 2009 120 000 000 1.25 1:4 150<br />
Holding<br />
percentage<br />
1–1 000 5 415 1 605 463 1.34%<br />
1 001–10 000 1 578 4 223 061 3.52%<br />
10 001–100 000 168 5 165 773 4.30%<br />
100 001–1 000 000 43 12 725 586 10.60%<br />
1 000 001–10 000 000 7 25 970 784 21.64%<br />
Over 10 000 000 2 70 309 333 58.59%<br />
Total 7 213 120 000 000 100.00%<br />
By the 7 213 share holders at 31 December <strong>2011</strong>, 740 foreign shareholders<br />
owned a total of 8.69 per cent of the shares.


