

Amparo Castelló-Climent, Universidad Carlos III de Madrid ... - Ivie

You also want an ePaper? Increase the reach of your titles
YUMPU automatically turns print PDFs into web optimized ePapers that Google loves.
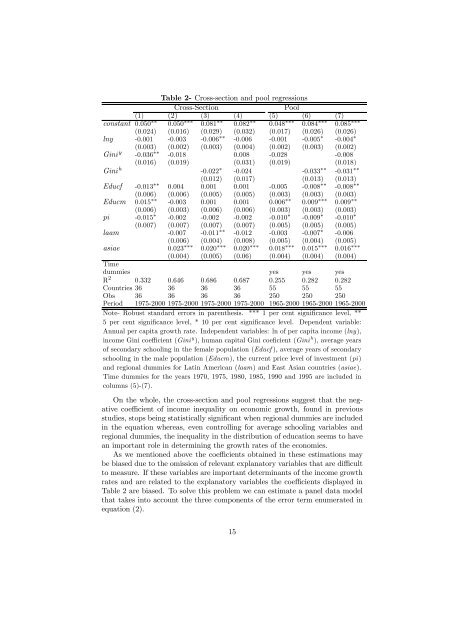
Table 2- Cross-section and pool regressions<br />
Cross-Section<br />
Pool<br />
(1) (2) (3) (4) (5) (6) (7)<br />
constant 0.050 ∗∗ 0.050 ∗∗∗ 0.081 ∗∗ 0.082 ∗∗ 0.048 ∗∗∗ 0.084 ∗∗∗ 0.085 ∗∗∗<br />
(0.024) (0.016) (0.029) (0.032) (0.017) (0.026) (0.026)<br />
lny -0.001 -0.003 -0.006 ∗∗ -0.006 -0.001 -0.005 ∗ -0.004 ∗<br />
(0.003) (0.002) (0.003) (0.004) (0.002) (0.003) (0.002)<br />
Gini y -0.036 ∗∗ -0.018 0.008 -0.028 -0.008<br />
(0.016) (0.019) (0.031) (0.019) (0.018)<br />
Gini h -0.022 ∗ -0.024 -0.033 ∗∗ -0.031 ∗∗<br />
(0.012) (0.017) (0.013) (0.013)<br />
Educf -0.013 ∗∗ 0.004 0.001 0.001 -0.005 -0.008 ∗∗ -0.008 ∗∗<br />
(0.006) (0.006) (0.005) (0.005) (0.003) (0.003) (0.003)<br />
Educm 0.015 ∗∗ -0.003 0.001 0.001 0.006 ∗∗ 0.009 ∗∗∗ 0.009 ∗∗<br />
(0.006) (0.003) (0.006) (0.006) (0.003) (0.003) (0.003)<br />
pi -0.015 ∗ -0.002 -0.002 -0.002 -0.010 ∗ -0.009 ∗ -0.010 ∗<br />
(0.007) (0.007) (0.007) (0.007) (0.005) (0.005) (0.005)<br />
laam -0.007 -0.011 ∗∗ -0.012 -0.003 -0.007 ∗ -0.006<br />
(0.006) (0.004) (0.008) (0.005) (0.004) (0.005)<br />
asiae 0.023 ∗∗∗ 0.020 ∗∗∗ 0.020 ∗∗∗ 0.018 ∗∗∗ 0.015 ∗∗∗ 0.016 ∗∗∗<br />
(0.004) (0.005) (0.06) (0.004) (0.004) (0.004)<br />
Time<br />
dummies yes yes yes<br />
R 2 0.332 0.646 0.686 0.687 0.255 0.282 0.282<br />
Countries 36 36 36 36 55 55 55<br />
Obs 36 36 36 36 250 250 250<br />
Period 1975-2000 1975-2000 1975-2000 1975-2000 1965-2000 1965-2000 1965-2000<br />
Note- Robust standard errors in parenthesis. *** 1 per cent significance level, **<br />
5 per cent significance level, * 10 per cent significance level. Depen<strong>de</strong>nt variable:<br />
Annual per capita growth rate. In<strong>de</strong>pen<strong>de</strong>nt variables: ln of per capita income (lny),<br />
income Gini coefficient (Gini y ), human capital Gini coeficient (Gini h ), average years<br />
of secondary schooling in the female population (Educf ), average years of secondary<br />
schooling in the male population (Educm), the current price level of investment (pi)<br />
and regional dummies for Latin American (laam) and East Asian countries (asiae).<br />
Time dummies for the years 1970, 1975, 1980, 1985, 1990 and 1995 are inclu<strong>de</strong>d in<br />
columns (5)-(7).<br />
On the whole, the cross-section and pool regressions suggest that the negative<br />
coefficient of income inequality on economic growth, found in previous<br />
studies, stops being statistically significant when regional dummies are inclu<strong>de</strong>d<br />
in the equation whereas, even controlling for average schooling variables and<br />
regional dummies, the inequality in the distribution of education seems to have<br />
an important role in <strong>de</strong>termining the growth rates of the economies.<br />
As we mentioned above the coefficients obtained in these estimations may<br />
be biased due to the omission of relevant explanatory variables that are difficult<br />
to measure. If these variables are important <strong>de</strong>terminants of the income growth<br />
rates and are related to the explanatory variables the coefficients displayed in<br />
Table 2 are biased. To solve this problem we can estimate a panel data mo<strong>de</strong>l<br />
that takes into account the three components of the error term enumerated in<br />
equation (2).<br />
15


