

Amparo Castelló-Climent, Universidad Carlos III de Madrid ... - Ivie

You also want an ePaper? Increase the reach of your titles
YUMPU automatically turns print PDFs into web optimized ePapers that Google loves.
Sub-Saharan African countries are still un<strong>de</strong>rrepresented. 12<br />
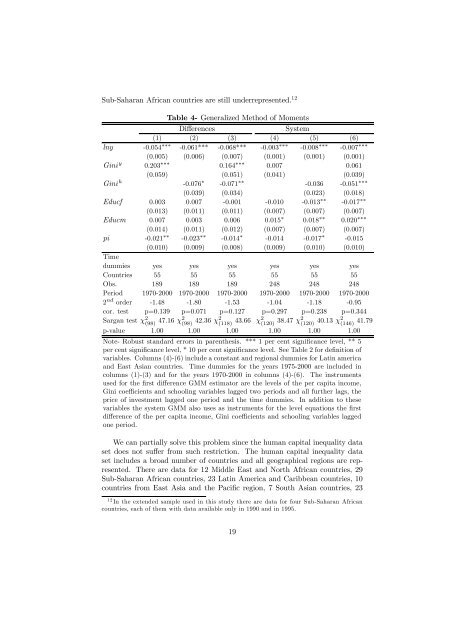
Table 4- Generalized Method of Moments<br />
Differences<br />
System<br />
(1) (2) (3) (4) (5) (6)<br />
lny -0.054 ∗∗∗ -0.061*** -0.068*** -0.003 ∗∗∗ -0.008 ∗∗∗ -0.007 ∗∗∗<br />
(0.005) (0.006) (0.007) (0.001) (0.001) (0.001)<br />
Gini y 0.203 ∗∗∗ 0.164 ∗∗∗ 0.007 0.061<br />
(0.059) (0.051) (0.041) (0.039)<br />
Gini h -0.076 ∗ -0.071 ∗∗ -0.036 -0.051 ∗∗∗<br />
(0.039) (0.034) (0.023) (0.018)<br />
Educf 0.003 0.007 -0.001 -0.010 -0.013 ∗∗ -0.017 ∗∗<br />
(0.013) (0.011) (0.011) (0.007) (0.007) (0.007)<br />
Educm 0.007 0.003 0.006 0.015 ∗ 0.018 ∗∗ 0.020 ∗∗∗<br />
(0.014) (0.011) (0.012) (0.007) (0.007) (0.007)<br />
pi -0.021 ∗∗ -0.023 ∗∗ -0.014 ∗ -0.014 -0.017 ∗ -0.015<br />
(0.010) (0.009) (0.008) (0.009) (0.010) (0.010)<br />
Time<br />
dummies yes yes yes yes yes yes<br />
Countries 55 55 55 55 55 55<br />
Obs. 189 189 189 248 248 248<br />
Period 1970-2000 1970-2000 1970-2000 1970-2000 1970-2000 1970-2000<br />
2 nd or<strong>de</strong>r -1.48 -1.80 -1.53 -1.04 -1.18 -0.95<br />
cor. test p=0.139 p=0.071 p=0.127 p=0.297 p=0.238 p=0.344<br />
Sargan test χ 2 (98) 47.16 χ2 (98) 42.36 χ2 (118) 43.66 χ2 (120) 38.47 χ2 (120) 40.13 χ2 (146) 41.79<br />
p-value 1.00 1.00 1.00 1.00 1.00 1.00<br />
Note- Robust standard errors in parenthesis. *** 1 per cent significance level, ** 5<br />
per cent significance level, * 10 per cent significance level. See Table 2 for <strong>de</strong>finition of<br />
variables. Columns (4)-(6) inclu<strong>de</strong> a constant and regional dummies for Latin america<br />
and East Asian countries. Time dummies for the years 1975-2000 are inclu<strong>de</strong>d in<br />
columns (1)-(3) and for the years 1970-2000 in columns (4)-(6). The instruments<br />
used for the first difference GMM estimator are the levels of the per capita income,<br />
Gini coefficients and schooling variables lagged two periods and all further lags, the<br />
price of investment lagged one period and the time dummies. In addition to these<br />
variables the system GMM also uses as instruments for the level equations the first<br />
difference of the per capita income, Gini coefficients and schooling variables lagged<br />
one period.<br />
We can partially solve this problem since the human capital inequality data<br />
set does not suffer from such restriction. The human capital inequality data<br />
set inclu<strong>de</strong>s a broad number of countries and all geographical regions are represented.<br />
There are data for 12 Middle East and North African countries, 29<br />
Sub-Saharan African countries, 23 Latin America and Caribbean countries, 10<br />
countries from East Asia and the Pacific region, 7 South Asian countries, 23<br />
12 In the exten<strong>de</strong>d sample used in this study there are data for four Sub-Saharan African<br />
countries, each of them with data available only in 1990 and in 1995.<br />
19


