

Amparo Castelló-Climent, Universidad Carlos III de Madrid ... - Ivie

Create successful ePaper yourself
Turn your PDF publications into a flip-book with our unique Google optimized e-Paper software.
Average Fertility Rate 1960-1<br />
9<br />
8<br />
7<br />
6<br />
5<br />
4<br />
3<br />
2<br />
ZWE<br />
BOL<br />
PHL ECU<br />
PRY LSO DOMPER<br />
MEX ZAF<br />
THA<br />
VEN<br />
CR<br />
COL<br />
BRA<br />
GUY JAM<br />
PAN<br />
FJI<br />
TTO CHL<br />
IRL ISR<br />
ARG<br />
NZLISLBRB<br />
URY<br />
AU FRA ESP CYP<br />
NLD GBR<br />
POL NORCAN<br />
HUN FIN<br />
BEL DNK<br />
USA AUT<br />
SWE JPN DEU CHE ITAGRCYUG<br />
LKA<br />
HKG<br />
MUOAN<br />
PRT<br />
KEN<br />
MW<br />
SYR JOR<br />
DZA<br />
HND<br />
PAK IRQ<br />
UGA BWA<br />
NICZMB<br />
SEN GTM KW GHASDN NER<br />
SWZ BGD MOZ<br />
LBR MRT ML IRN SLE<br />
SLV PNGZAR<br />
BHR<br />
TUN NPL<br />
CMR<br />
IND HT<br />
MY<br />
TUR<br />
KOR<br />
SGP<br />
IDN<br />
CAF<br />
1<br />
0<br />
0 0,1 0,2 0,3 0,4 0,5 0,6 0,7 0,8 0,9 1<br />
Human Capital Gini coeffic<br />
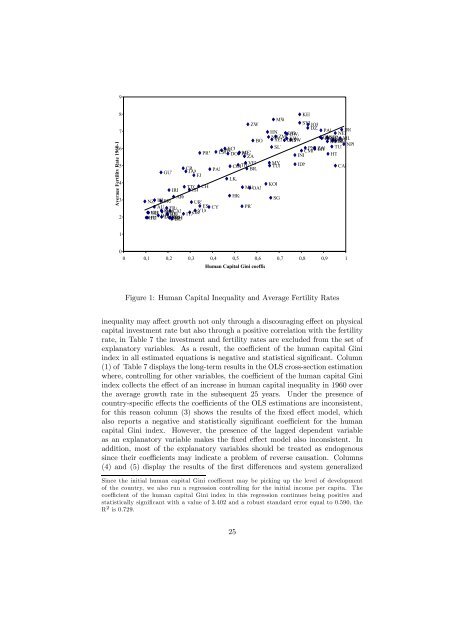
Figure 1: Human Capital Inequality and Average Fertility Rates<br />
inequality may affect growth not only through a discouraging effect on physical<br />
capital investment rate but also through a positive correlation with the fertility<br />
rate, in Table 7 the investment and fertility rates are exclu<strong>de</strong>d from the set of<br />
explanatory variables. As a result, the coefficient of the human capital Gini<br />
in<strong>de</strong>x in all estimated equations is negative and statistical significant. Column<br />
(1) of Table 7 displays the long-term results in the OLS cross-section estimation<br />
where, controlling for other variables, the coefficient of the human capital Gini<br />
in<strong>de</strong>x collects the effect of an increase in human capital inequality in 1960 over<br />
the average growth rate in the subsequent 25 years. Un<strong>de</strong>r the presence of<br />
country-specific effects the coefficients of the OLS estimations are inconsistent,<br />
for this reason column (3) shows the results of the fixed effect mo<strong>de</strong>l, which<br />
also reports a negative and statistically significant coefficient for the human<br />
capital Gini in<strong>de</strong>x. However, the presence of the lagged <strong>de</strong>pen<strong>de</strong>nt variable<br />
as an explanatory variable makes the fixed effect mo<strong>de</strong>l also inconsistent. In<br />
addition, most of the explanatory variables should be treated as endogenous<br />
since their coefficients may indicate a problem of reverse causation. Columns<br />
(4) and (5) display the results of the first differences and system generalized<br />
Since the initial human capital Gini coefficent may be picking up the level of <strong>de</strong>velopment<br />
of the country, we also run a regression controlling for the initial income per capita. The<br />
coefficient of the human capital Gini in<strong>de</strong>x in this regression continues being positive and<br />
statistically significant with a value of 3.402 and a robust standard error equal to 0.590, the<br />
R 2 is 0.729.<br />
25


