

Amparo Castelló-Climent, Universidad Carlos III de Madrid ... - Ivie

You also want an ePaper? Increase the reach of your titles
YUMPU automatically turns print PDFs into web optimized ePapers that Google loves.
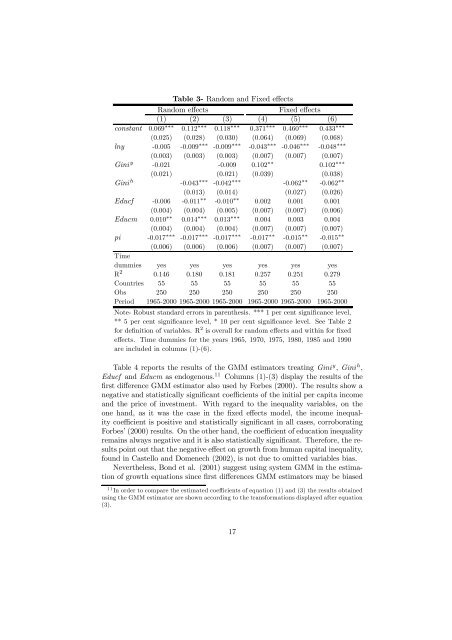
Table 3- Random and Fixed effects<br />
Random effects<br />
Fixed effects<br />
(1) (2) (3) (4) (5) (6)<br />
constant 0.069 ∗∗∗ 0.112 ∗∗∗ 0.118 ∗∗∗ 0.371 ∗∗∗ 0.460 ∗∗∗ 0.433 ∗∗∗<br />
(0.025) (0.028) (0.030) (0.064) (0.069) (0.068)<br />
lny -0.005 -0.009 ∗∗∗ -0.009 ∗∗∗ -0.043 ∗∗∗ -0.046 ∗∗∗ -0.048 ∗∗∗<br />
(0.003) (0.003) (0.003) (0.007) (0.007) (0.007)<br />
Gini y -0.021 -0.009 0.102 ∗∗ 0.102 ∗∗∗<br />
(0.021) (0.021) (0.039) (0.038)<br />
Gini h -0.043 ∗∗∗ -0.042 ∗∗∗ -0.062 ∗∗ -0.062 ∗∗<br />
(0.013) (0.014) (0.027) (0.026)<br />
Educf -0.006 -0.011 ∗∗ -0.010 ∗∗ 0.002 0.001 0.001<br />
(0.004) (0.004) (0.005) (0.007) (0.007) (0.006)<br />
Educm 0.010 ∗∗ 0.014 ∗∗∗ 0.013 ∗∗∗ 0.004 0.003 0.004<br />
(0.004) (0.004) (0.004) (0.007) (0.007) (0.007)<br />
pi -0.017 ∗∗∗ -0.017 ∗∗∗ -0.017 ∗∗∗ -0.017 ∗∗ -0.015 ∗∗ -0.015 ∗∗<br />
(0.006) (0.006) (0.006) (0.007) (0.007) (0.007)<br />
Time<br />
dummies yes yes yes yes yes yes<br />
R 2 0.146 0.180 0.181 0.257 0.251 0.279<br />
Countries 55 55 55 55 55 55<br />
Obs 250 250 250 250 250 250<br />
Period 1965-2000 1965-2000 1965-2000 1965-2000 1965-2000 1965-2000<br />
Note- Robust standard errors in parenthesis. *** 1 per cent significance level,<br />
** 5 per cent significance level, * 10 per cent significance level. See Table 2<br />
for <strong>de</strong>finition of variables. R 2 is overall for random effectsandwithinforfixed<br />
effects. Time dummies for the years 1965, 1970, 1975, 1980, 1985 and 1990<br />
are inclu<strong>de</strong>d in columns (1)-(6).<br />
Table 4 reports the results of the GMM estimators treating Gini y , Gini h ,<br />
Educf and Educm as endogenous. 11 Columns (1)-(3) display the results of the<br />
first difference GMM estimator also used by Forbes (2000). The results show a<br />
negative and statistically significant coefficients of the initial per capita income<br />
and the price of investment. With regard to the inequality variables, on the<br />
one hand, as it was the case in the fixed effects mo<strong>de</strong>l, the income inequality<br />
coefficient is positive and statistically significant in all cases, corroborating<br />
Forbes’ (2000) results. On the other hand, the coefficient of education inequality<br />
remains always negative and it is also statistically significant. Therefore, the results<br />
point out that the negative effect on growth from human capital inequality,<br />
found in Castello and Domenech (2002), is not due to omitted variables bias.<br />
Nevertheless, Bond et al. (2001) suggest using system GMM in the estimation<br />
of growth equations since first differences GMM estimators may be biased<br />
11 In or<strong>de</strong>r to compare the estimated coefficients of equation (1) and (3) the results obtained<br />
using the GMM estimator are shown according to the transformations displayed after equation<br />
(3).<br />
17


