

Amparo Castelló-Climent, Universidad Carlos III de Madrid ... - Ivie

You also want an ePaper? Increase the reach of your titles
YUMPU automatically turns print PDFs into web optimized ePapers that Google loves.
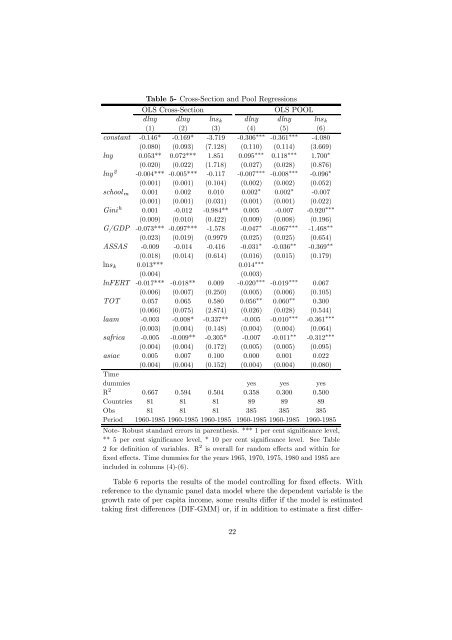
Table 5- Cross-Section and Pool Regressions<br />
OLS Cross-Section<br />
OLS POOL<br />
dlny dlny lns k dlny dlny lns k<br />
(1) (2) (3) (4) (5) (6)<br />
constant -0.146* -0.169* -3.719 -0.306 ∗∗∗ -0.361 ∗∗∗ -4.080<br />
(0.080) (0.093) (7.128) (0.110) (0.114) (3.669)<br />
lny 0.053** 0.072*** 1.851 0.095 ∗∗∗ 0.118 ∗∗∗ 1.700 ∗<br />
(0.020) (0.022) (1.718) (0.027) (0.028) (0.876)<br />
lny 2 -0.004*** -0.005*** -0.117 -0.007 ∗∗∗ -0.008 ∗∗∗ -0.096 ∗<br />
(0.001) (0.001) (0.104) (0.002) (0.002) (0.052)<br />
school m 0.001 0.002 0.010 0.002 ∗ 0.002 ∗ -0.007<br />
(0.001) (0.001) (0.031) (0.001) (0.001) (0.022)<br />
Gini h 0.001 -0.012 -0.984** 0.005 -0.007 -0.920 ∗∗∗<br />
(0.009) (0.010) (0.422) (0.009) (0.008) (0.196)<br />
G/GDP -0.073*** -0.097*** -1.578 -0.047 ∗ -0.067 ∗∗∗ -1.468 ∗∗<br />
(0.023) (0.019) (0.9979 (0.025) (0.025) (0.654)<br />
ASSAS -0.009 -0.014 -0.416 -0.031 ∗ -0.036 ∗∗ -0.369 ∗∗<br />
(0.018) (0.014) (0.614) (0.016) (0.015) (0.179)<br />
lns k 0.013*** 0.014 ∗∗∗<br />
(0.004) (0.003)<br />
lnFERT -0.017*** -0.018** 0.009 -0.020 ∗∗∗ -0.019 ∗∗∗ 0.067<br />
(0.006) (0.007) (0.250) (0.005) (0.006) (0.105)<br />
TOT 0.057 0.065 0.580 0.056 ∗∗ 0.060 ∗∗ 0.300<br />
(0.066) (0.075) (2.874) (0.026) (0.028) (0.544)<br />
laam -0.003 -0.008* -0.337** -0.005 -0.010 ∗∗∗ -0.361 ∗∗∗<br />
(0.003) (0.004) (0.148) (0.004) (0.004) (0.064)<br />
safrica -0.005 -0.009** -0.305* -0.007 -0.011 ∗∗ -0.312 ∗∗∗<br />
(0.004) (0.004) (0.172) (0.005) (0.005) (0.095)<br />
asiae 0.005 0.007 0.100 0.000 0.001 0.022<br />
(0.004) (0.004) (0.152) (0.004) (0.004) (0.080)<br />
Time<br />
dummies yes yes yes<br />
R 2 0.667 0.594 0.504 0.358 0.300 0.500<br />
Countries 81 81 81 89 89 89<br />
Obs 81 81 81 385 385 385<br />
Period 1960-1985 1960-1985 1960-1985 1960-1985 1960-1985 1960-1985<br />
Note- Robust standard errors in parenthesis. *** 1 per cent significance level,<br />
** 5 per cent significance level, * 10 per cent significance level. See Table<br />
2for<strong>de</strong>finition of variables. R 2 is overall for random effectsandwithinfor<br />
fixed effects. Time dummies for the years 1965, 1970, 1975, 1980 and 1985 are<br />
inclu<strong>de</strong>d in columns (4)-(6).<br />
Table 6 reports the results of the mo<strong>de</strong>l controlling for fixed effects. With<br />
reference to the dynamic panel data mo<strong>de</strong>l where the <strong>de</strong>pen<strong>de</strong>nt variable is the<br />
growth rate of per capita income, some results differ if the mo<strong>de</strong>l is estimated<br />
taking first differences (DIF-GMM) or, if in addition to estimate a first differ-<br />
22


