

Amparo Castelló-Climent, Universidad Carlos III de Madrid ... - Ivie

You also want an ePaper? Increase the reach of your titles
YUMPU automatically turns print PDFs into web optimized ePapers that Google loves.
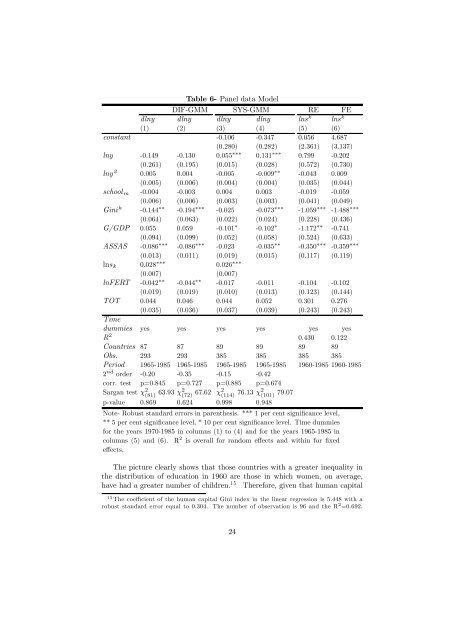
Table 6- Panel data Mo<strong>de</strong>l<br />
DIF-GMM SYS-GMM RE FE<br />
dlny dlny dlny dlny lns k lns k<br />
(1) (2) (3) (4) (5) (6)<br />
constant -0.106 -0.347 0.056 4.687<br />
(0.280) (0.282) (2.361) (3.137)<br />
lny -0.149 -0.130 0.055 ∗∗∗ 0.131 ∗∗∗ 0.799 -0.202<br />
(0.261) (0.195) (0.015) (0.028) (0.572) (0.730)<br />
lny 2 0.005 0.004 -0.005 -0.009 ∗∗ -0.043 0.009<br />
(0.005) (0.006) (0.004) (0.004) (0.035) (0.044)<br />
school m -0.004 -0.003 0.004 0.003 -0.019 -0.059<br />
(0.006) (0.006) (0.003) (0.003) (0.041) (0.049)<br />
Gini h -0.144 ∗∗ -0.194 ∗∗∗ -0.025 -0.073 ∗∗∗ -1.059 ∗∗∗ -1.488 ∗∗∗<br />
(0.064) (0.063) (0.022) (0.024) (0.228) (0.436)<br />
G/GDP 0.055 0.059 -0.101 ∗ -0.102 ∗ -1.172 ∗∗ -0.741<br />
(0.094) (0.099) (0.052) (0.058) (0.524) (0.633)<br />
ASSAS -0.086 ∗∗∗ -0.086 ∗∗∗ -0.023 -0.035 ∗∗ -0.350 ∗∗∗ -0.359 ∗∗∗<br />
(0.013) (0.011) (0.019) (0.015) (0.117) (0.119)<br />
lns k 0.028 ∗∗∗ 0.026 ∗∗∗<br />
(0.007) (0.007)<br />
lnFERT -0.042 ∗∗ -0.044 ∗∗ -0.017 -0.011 -0.104 -0.102<br />
(0.019) (0.019) (0.010) (0.013) (0.123) (0.144)<br />
TOT 0.044 0.046 0.044 0.052 0.301 0.276<br />
(0.035) (0.036) (0.037) (0.039) (0.243) (0.243)<br />
Time<br />
dummies yes yes yes yes yes yes<br />
R 2 0.430 0.122<br />
Countries 87 87 89 89 89 89<br />
Obs. 293 293 385 385 385 385<br />
Period 1965-1985 1965-1985 1965-1985 1965-1985 1960-1985 1960-1985<br />
2 nd or<strong>de</strong>r -0.20 -0.35 -0.15 -0.42<br />
corr. test p=0.845 p=0.727 p=0.885 p=0.674<br />
Sargan test χ 2 (81) 63.93 χ2 (72) 67.62 χ2 (114) 76.13 χ2 (101) 79.07<br />
p-value 0.869 0.624 0.998 0.948<br />
Note- Robust standard errors in parenthesis. *** 1 per cent significance level,<br />
** 5 per cent significance level, * 10 per cent significance level. Time dummies<br />
for the years 1970-1985 in columns (1) to (4) and for the years 1965-1985 in<br />
columns (5) and (6). R 2 is overall for random effectsandwithinforfixed<br />
effects.<br />
The picture clearly shows that those countries with a greater inequality in<br />
the distribution of education in 1960 are those in which women, on average,<br />
have had a greater number of children. 15 Therefore, given that human capital<br />
15 The coefficient of the human capital Gini in<strong>de</strong>x in the linear regression is 5.448 with a<br />
robust standard error equal to 0.304. The number of observation is 96 and the R 2 =0.692.<br />
24


