Fiji
yqgk302EGjo
yqgk302EGjo

You also want an ePaper? Increase the reach of your titles
YUMPU automatically turns print PDFs into web optimized ePapers that Google loves.
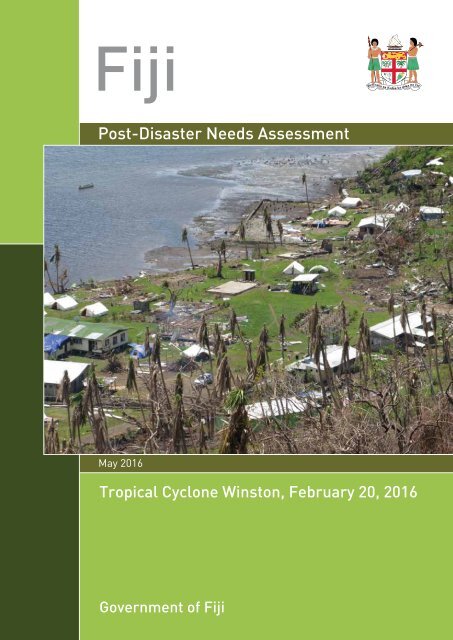
<strong>Fiji</strong><br />
Post-Disaster Needs Assessment<br />
May 2016<br />
Tropical Cyclone Winston, February 20, 2016<br />
Government of <strong>Fiji</strong>
Published by: Government of <strong>Fiji</strong><br />
Lead Author: Simone Esler<br />
Copy-edit: Leila Mead<br />
Design: Sailesh Kumar Sen, SPC<br />
Front Cover Photo: Damaged village on north-east of Viti Levu. Photo by Chris Wensley, ADB<br />
Back Cover Photo: Southern Taveuni Island, near Kanacea. Photo by Vlad Sokhin, World Bank
<strong>Fiji</strong><br />
Post-Disaster Needs Assessment<br />
Tropical Cyclone Winston, February 20, 2016<br />
May 2016<br />
Government of <strong>Fiji</strong><br />
i
Empowered lives. Resilient nations.<br />
Supported and facilitated by<br />
With financial support by<br />
ACP-EU Natural Disaster Risk Reduction Program<br />
An initiative of the African, Caribbean and Pacific Group, funded by the European Union and managed by GFDRR<br />
Technical input by<br />
United Nations<br />
Educational, Scientific and<br />
Cultural Organization<br />
Currency and equivalents:<br />
Currency unit = <strong>Fiji</strong> Dollar (F$)<br />
F$2.15 = US$1 1<br />
Fiscal year: August 1–July 31<br />
1<br />
Exchange rate on February 22, 2016<br />
ii
FIJI Post-Disaster Needs Assessment<br />
Table of Contents<br />
LIST OF TABLES.................................................................................................................................... 4<br />
LIST OF FIGURES................................................................................................................................. 6<br />
LIST OF TEXTBOX................................................................................................................................. 6<br />
ACRONYMS AND ABBREVIATIONS..................................................................................................... 7<br />
ACKNOWLEDGEMENTS....................................................................................................................... 8<br />
EXECUTIVE SUMMARY......................................................................................................................... 9<br />
SUMMARY OF DAMAGE AND LOSSES.......................................................................................................................... 10<br />
SUMMARY OF ECONOMIC AND SOCIAL IMPACT......................................................................................................... 15<br />
SUMMARY OF RECOVERY AND RECONSTRUCTION NEEDS...................................................................................... 16<br />
WAY FORWARD............................................................................................................................................................... 17<br />
1. INTRODUCTION.......................................................................................................................... 18<br />
1.1 DISASTER RISK PROFILE OF FIJI......................................................................................................................... 19<br />
1.2 SOCIOECONOMIC CONTEXT OF FIJI.................................................................................................................. 19<br />
1.3 TROPICAL CYCLONE WINSTON.......................................................................................................................... 19<br />
1.4 RESPONSE FROM THE GOVERNMENT AND DEVELOPMENT PARTNERS........................................................ 20<br />
1.5 POST-DISASTER NEEDS ASSESSMENT METHODOLOGY.................................................................................. 21<br />
1.5.1 Assessment of Disaster Effects.................................................................................................................. 22<br />
1.5.2 Assessment of Disaster Impact.................................................................................................................. 22<br />
1.5.3 Quality of Life............................................................................................................................................. 22<br />
1.5.4 Recovery and Reconstruction Strategy and Needs..................................................................................... 23<br />
1.5.5 Specific Context of this PDNA.................................................................................................................... 23<br />
1.5.6 Limitations of this Assessment................................................................................................................... 23<br />
2. ECONOMIC AND SOCIAL IMPACTS.......................................................................................... 24<br />
2.1 MACROECONOMIC IMPACT................................................................................................................................. 25<br />
2.1.1 Pre-Disaster Economic Outlook................................................................................................................. 25<br />
2.1.2 Post-Disaster Economic Outlook............................................................................................................... 26<br />
2.2 EMPLOYMENT, LIVELIHOODS AND SOCIAL PROTECTION................................................................................ 27<br />
2.2.1 Summary.................................................................................................................................................... 27<br />
2.2.2 ESLP Sector Background........................................................................................................................... 29<br />
2.2.3 Assessment of Disaster Impact.................................................................................................................. 32<br />
2.2.4 Recovery Strategy and Needs.................................................................................................................... 35<br />
2.3 DISASTER IMPACT ON QUALITY OF LIFE............................................................................................................ 36<br />
2.3.1 Quantification of Sectoral Quality of Life Indicators..................................................................................... 37<br />
2.3.2 Composite Index on Quality of Life............................................................................................................. 42<br />
2.3.3 Most Affected Provinces............................................................................................................................ 43<br />
2.3.4 Use of the Quality of Life Index as a Measure of Recovery.......................................................................... 44<br />
Tropical Cyclone Winston, February 20, 2016<br />
1
FIJI Post-Disaster Needs Assessment<br />
3. DAMAGE, LOSSES AND NEEDS BY SECTOR........................................................................... 46<br />
3.1 PRODUCTIVE SECTORS....................................................................................................................................... 47<br />
3.1.1 Agriculture.................................................................................................................................................. 47<br />
3.1.2 Commerce and Manufacturing................................................................................................................... 53<br />
3.1.3 Tourism...................................................................................................................................................... 57<br />
3.1.4 Mining Sector............................................................................................................................................. 61<br />
3.2 SOCIAL SECTORS................................................................................................................................................. 64<br />
3.2.1 Education................................................................................................................................................... 64<br />
3.2.2 Health........................................................................................................................................................ 72<br />
3.2.3 Housing..................................................................................................................................................... 73<br />
3.3 INFRASTRUCTURE SECTORS.............................................................................................................................. 78<br />
3.3.1 Transport.................................................................................................................................................... 78<br />
3.3.2 Water and Sanitation.................................................................................................................................. 82<br />
3.3.3 Electricity.................................................................................................................................................... 86<br />
3.3.4 Communications........................................................................................................................................ 91<br />
3.4 CROSS-CUTTING ISSUES.................................................................................................................................... 95<br />
3.4.1 Environment............................................................................................................................................... 95<br />
3.4.2 Gender and Social Inclusion....................................................................................................................... 99<br />
3.4.3 Culture and Heritage.................................................................................................................................. 105<br />
4. DISASTER RISK MANAGEMENT................................................................................................ 109<br />
4.1 INTRODUCTION.................................................................................................................................................... 110<br />
4.2 DRM SECTOR BACKGROUND............................................................................................................................. 110<br />
4.3 DAMAGE AND LOSSES TO THE DRM SECTOR.................................................................................................. 111<br />
4.4 PERFORMANCE OF THE FIJI DRM SYSTEM....................................................................................................... 112<br />
4.4.1 Tropical Cyclone Forecasting...................................................................................................................... 112<br />
4.4.2 Early Warning............................................................................................................................................. 112<br />
4.4.3 Addressing the Needs of Vulnerable Groups............................................................................................... 112<br />
4.4.4 Key Highlights............................................................................................................................................ 113<br />
4.4.5 Areas for Improvement............................................................................................................................... 113<br />
4.4.6 Partnerships............................................................................................................................................... 114<br />
4.4.7 Monitoring and Evaluation.......................................................................................................................... 115<br />
4.5 UNDERSTANDING RISK........................................................................................................................................ 115<br />
4.5.1 Identifying Increased Risks as a Result of TC Winston................................................................................ 116<br />
4.5.2 Promoting Risk Awareness at the Community Level................................................................................... 116<br />
4.6 FUNDING AND FINANCE MECHANISMS............................................................................................................. 116<br />
4.6.1 Building Fiscal Resilience............................................................................................................................ 116<br />
4.6.2 Disaster Risk Finance Tools in <strong>Fiji</strong>................................................................................................................ 116<br />
4.6.3 Developing a Disaster Risk Finance and Insurance (DRFI) Strategy............................................................. 117<br />
4.7 RECOVERY AND RECONSTRUCTION NEEDS FOR DRM.................................................................................... 117<br />
5. SUMMARY OF RECOVERY, RECONSTRUCTION AND RESILIENCE NEEDS........................... 118<br />
5.1 MODALITIES FOR RECOVERY AND RECONSTRUCTION................................................................................... 119<br />
5.2 OVERVIEW OF RECOVERY AND RECONSTRUCTION NEEDS............................................................................ 119<br />
5.2.1 Production Recovery.................................................................................................................................. 120<br />
5.2.2 Service Supply and Access Recovery......................................................................................................... 120<br />
5.2.3 Personal and Household Income Recovery................................................................................................. 121<br />
5.2.4 Reconstruction........................................................................................................................................... 121<br />
2 Tropical Cyclone Winston, February 20, 2016
FIJI Post-Disaster Needs Assessment<br />
6. WAY FORWARD.......................................................................................................................... 122<br />
6.1 DEVELOPMENT OF A DISASTER RECOVERY FRAMEWORK.............................................................................. 123<br />
6.2 INSTITUTIONAL AND POLICY SETUP (INCLUDING GOODS AND SERVICES)................................................... 123<br />
ANNEX................................................................................................................................................... 124<br />
ANNEX 1: DETAILED BREAKDOWN OF DISASTER EFFECTS........................................................................................ 125<br />
ANNEX 2: DETAILED BREAKDOWN OF RECOVERY NEEDS BY SECTOR.................................................................... 130<br />
ANNEX 3: SUPPLEMENTARY MATERIAL FOR EMPLOYMENT, LIVELIHOODS AND SOCIAL Protection..................... 141<br />
ANNEX 4: SUPPLEMENTARY MATERIAL FOR THE COMMERCE AND MANUFACTURING SECTORS........................ 143<br />
ANNEX 5: SUPPLEMENTARY MATERIAL FOR THE HOUSING SECTOR....................................................................... 144<br />
ANNEX 6: DISASTER RISK MANAGEMENT.................................................................................................................... 147<br />
ANNEX 7: LIST OF CONTRIBUTORS............................................................................................................................... 149<br />
ANNEX 8: REFERENCES AND MATERIALS CONSULTED.............................................................................................. 151<br />
ANNEX 9: MAP OF FIJI.................................................................................................................................................... 153<br />
Tropical Cyclone Winston, February 20, 2016<br />
3
FIJI Post-Disaster Needs Assessment<br />
List of Tables<br />
Table 1: Summary of Disaster Effects by Sector.......................................................................................................................................... 10<br />
Table 2: Total Damage and Production Losses Caused by TC Winston by Province (F$ million).................................................................. 13<br />
Table 3: Estimated Value of Per Capita Disaster Effects per Province (F$/person)....................................................................................... 14<br />
Table 4: Population Affected by TC Winston.............................................................................................................................................. 16<br />
Table 5: Recovery and Reconstruction Needs by Sector (F$ million)........................................................................................................... 17<br />
Table 6: Balance of Payments: Trade in Goods (F$ million)......................................................................................................................... 27<br />
Table 7: Population Affected by TC Winston............................................................................................................................................... 28<br />
Table 8: Incidence of Poverty (percent) by Division...................................................................................................................................... 31<br />
Table 9: Work Days and Personal Income Lost by Division......................................................................................................................... 33<br />
Table 10: Work Days and Personal Income Lost by Productive Sectors and Transport Sector...................................................................... 33<br />
Table 11: Major Social Protection Interventions and Cash Flow Post-TC Winston......................................................................................... 34<br />
Table 12: Total Recovery and Reconstruction Needs for the ESLP Sector (F$ million)................................................................................... 36<br />
Table 13: Pre- and Post-Disaster Housing Data in Disaster-Affected Provinces............................................................................................. 37<br />
Table 14: Pre- and Post-Disaster Housing Index by Province........................................................................................................................ 37<br />
Table 15: Pre- and Post-Disaster Education Index by Province..................................................................................................................... 38<br />
Table 16: Pre- and Post-Disaster Health Index by Province.......................................................................................................................... 39<br />
Table 17: Pre- and Post-Disaster Water Supply Access Index by Province................................................................................................... 39<br />
Table 18: Pre- and Post-Disaster Sanitation Access Index by Province......................................................................................................... 40<br />
Table 19: Pre- and Post-Disaster Access to Electricity Index by Province..................................................................................................... 40<br />
Table 20: Pre- and Post-Disaster Personal Income Index by Province.......................................................................................................... 41<br />
Table 21: Pre- and Post-Disaster Composite Quality of Life Index by Province.............................................................................................. 42<br />
Table 22: Damage and Losses to Agriculture by Subsector (F$ million)......................................................................................................... 50<br />
Table 23: Damage and Losses to Agriculture by Division (F$ million)............................................................................................................. 50<br />
Table 24: Total Recovery and Reconstruction Needs for the Agriculture Sector (F$ million)........................................................................... 53<br />
Table 25: Total Damage and Losses in the Commerce and Manufacturing Sector (F$ million)...................................................................... 53<br />
Table 26: Contribution to GDP by Subsector (F$ million)............................................................................................................................... 54<br />
Table 27: Damage and Losses in Commerce and Manufacturing by Subsector (F$ million)........................................................................... 55<br />
Table 28: Total Recovery and Reconstruction Needs for the Commerce and Manufacturing Sector (F$ million)............................................. 57<br />
Table 29: Baseline Tourism Data for 2015..................................................................................................................................................... 59<br />
Table 30: Damage and Losses in the Tourism Sector by Division (F$ million)................................................................................................. 60<br />
Table 31: Damage and Estimated Rebuilding Cost for the Tourism Sector by Division (F$ million)................................................................. 61<br />
Table 32: Total Recovery and Reconstruction Needs for the Tourism Sector (F$ million)............................................................................... 61<br />
Table 33: Quantification of Damage and Losses in the Mining Sector (F$ million).......................................................................................... 62<br />
Table 34: Damage to Key Assets in the Mining Sector.................................................................................................................................. 62<br />
Table 35: Losses in the Mining Sector........................................................................................................................................................... 63<br />
Table 36: Total Recovery and Reconstruction Needs for the Mining Sector (F$ million).................................................................................. 63<br />
Table 37: Number of Schools by Division (as of 2014).................................................................................................................................. 65<br />
Table 38: Damage and Losses in the Education Sector by Division (F$ million)............................................................................................. 66<br />
Table 39: Total Recovery and Reconstruction Needs for the Education Sector (F$ million)............................................................................ 67<br />
Table 40: Intermediate and Long-Term Reconstruction Costs for the Education Sector (F$ million)............................................................... 68<br />
Table 41: Health Facilities in <strong>Fiji</strong>..................................................................................................................................................................... 69<br />
Table 42: Damage and Losses to the Health Sector by Division (F$ million).................................................................................................. 70<br />
Table 43: Recovery and Reconstruction Needs for the Health Sector (F$ million).......................................................................................... 71<br />
Table 44: Housing Stock by Type of Wall Material and Distribution by Division.............................................................................................. 73<br />
Table 45: Damage to the Housing Sector (F$ million)................................................................................................................................... 74<br />
Table 46: Value and Number of Houses91 Destroyed or Damaged by Division............................................................................................. 74<br />
Table 47: Losses in the Housing Sector by Type (F$ million)......................................................................................................................... 75<br />
Table 48: Materials Grant for Different Levels of Damage in the Housing Sector............................................................................................ 77<br />
Table 49: Total Recovery and Reconstruction Needs for the Housing Sector (F$ million)............................................................................... 77<br />
Table 50: <strong>Fiji</strong> Road Authority Assets by Division............................................................................................................................................ 79<br />
Table 51: Damage and Losses in the Transport Sector (F$ million)............................................................................................................... 81<br />
Table 52: Damage and Losses in the Transport Sector by Division............................................................................................................... 81<br />
Table 53: Total Recovery and Reconstruction Needs for the Transport Sector (F$ million)............................................................................. 82<br />
Table 54: Water- and Sanitation-Related Infrastructure (number of facilities).................................................................................................. 83<br />
Table 55: Damage and Losses in the Water and Sanitation Sector by Subsector (F$ million)........................................................................ 84<br />
4 Tropical Cyclone Winston, February 20, 2016
FIJI Post-Disaster Needs Assessment<br />
Table 56: Damage and Losses in the Water and Sanitation Sector by Division (F$ million)............................................................................. 85<br />
Table 57: Damage and Losses in the Water and Sanitation Sector by Ownership (F$ million)........................................................................ 85<br />
Table 58: Total Recovery and Reconstruction Needs for the Water and Sanitation Sector (F$ million)........................................................... 86<br />
Table 59: Baseline Assets in the Power Sector, January 2016...................................................................................................................... 87<br />
Table 60: Damage to the Power Sector by Division (percent of assets damaged)......................................................................................... 88<br />
Table 61: Estimated Cost of Damage in the Power Sector by Asset (F$)...................................................................................................... 89<br />
Table 62: Estimated Losses in the Electricity Sector (F$).............................................................................................................................. 90<br />
Table 63: Total Recovery and Reconstruction Needs for the Electricity Sector (F$ million)............................................................................. 90<br />
Table 64: Pre-Disaster Asset Valuation of the Communications Sector (F$ million)........................................................................................ 93<br />
Table 65: Damage and Losses to the Communications Sector (F$ million).................................................................................................... 93<br />
Table 66: Total Recovery and Reconstruction Needs for the Communications Sector (F$ million).................................................................. 94<br />
Table 67: Total Damage and Losses to the Environment Sector (F$ million).................................................................................................. 97<br />
Table 68: Total Recovery and Reconstruction Needs for the Environment Sector (F$ million)........................................................................ 99<br />
Table 69: Personal Income Losses Borne by Men and Women by Productive Sector and Transport Sector................................................. 102<br />
Table 70: Total Recovery and Reconstruction Needs for Gender Considerations (F$ million)........................................................................ 105<br />
Table 71: Damage and Losses in the Culture and Heritage Sector by Division (F$ million)............................................................................ 108<br />
Table 72: Total Recovery and Reconstruction Needs for the Culture and Heritage Sector (F$ million)........................................................... 108<br />
Table 73: Damage and Losses in the DRM Sector by Agency (F$ million)..................................................................................................... 111<br />
Table 74: Damage and Losses in the DRM Sector by Division (F$ million)..................................................................................................... 113<br />
Table 75: Recovery, Reconstruction and Resilience Needs in the DRM Sector (F$ million)............................................................................ 117<br />
Table 76: Recovery and Reconstruction Needs by Sector............................................................................................................................. 121<br />
Table 77: Summary of Damage, Loss and Effects by Sector and Ownership (F$ million)............................................................................... 125<br />
Table 78: Contribution of Each Sector to Total Damage and Losses............................................................................................................. 126<br />
Table 79: Summary of Damage by Ownership.............................................................................................................................................. 126<br />
Table 80: Summary of Losses by Ownership................................................................................................................................................ 127<br />
Table 81: Summary of Total Effects by Ownership........................................................................................................................................ 127<br />
Table 82: Summary of Total Effects by Public Ownership.............................................................................................................................. 128<br />
Table 83: Summary of Total Effects by Private Ownership............................................................................................................................. 128<br />
Table 84: Recovery and Reconstruction Needs for Agriculture...................................................................................................................... 130<br />
Table 85 Recovery and Reconstruction Needs for Commerce and Manufacturing....................................................................................... 133<br />
Table 86: Recovery and Reconstruction Needs for Tourism.......................................................................................................................... 133<br />
Table 87: Recovery and Reconstruction Needs for Mining............................................................................................................................ 133<br />
Table 88: Recovery and Reconstruction Needs for Education....................................................................................................................... 133<br />
Table 89: Recovery and Reconstruction Needs for Health............................................................................................................................ 134<br />
Table 90: Recovery and Reconstruction Needs for Housing......................................................................................................................... 134<br />
Table 91: Recovery and Reconstruction Needs for Transport........................................................................................................................ 135<br />
Table 92: Recovery and Reconstruction Needs for Water and Sanitation...................................................................................................... 136<br />
Table 93: Recovery, Reconstruction and Resilience Needs for Electricity....................................................................................................... 136<br />
Table 94: Recovery and Reconstruction Needs for Communications............................................................................................................ 137<br />
Table 95: Recovery and Reconstruction Needs for the Environment............................................................................................................. 137<br />
Table 96: Recovery and Reconstruction Needs for Gender and Social Inclusion........................................................................................... 138<br />
Table 97: Recovery and Reconstruction Needs for Culture and Heritage...................................................................................................... 138<br />
Table 98: Reconstruction and Resilience Needs for Disaster Risk Management............................................................................................ 139<br />
Table 99: Recovery and Reconstruction Needs for Employment, Livelihoods and Social Impact................................................................... 139<br />
Table 100: Population Affected by TC Winston............................................................................................................................................... 141<br />
Table 101: Poverty Alleviation Government Programmes by Year (F$ million).................................................................................................. 141<br />
Table 102: lEstimated Pre-Event Building Stock by Province.......................................................................................................................... 144<br />
Table 103: Breakdown of Affected Residential Buildings into Damage Levels by Province.............................................................................. 146<br />
Table 104: Assumptions Used to Determine Damage and Loss to the Housing Sector (Average Floor Size and Unit Cost<br />
for Various Building Materials)........................................................................................................................................................ 146<br />
Table 105: Estimated Damage to Residential Buildings by Division (F$ million)................................................................................................ 146<br />
Tropical Cyclone Winston, February 20, 2016<br />
5
FIJI Post-Disaster Needs Assessment<br />
List of Figures<br />
Figure 1: Projected Production Losses in the Agriculture Sector over Time.................................................................................................. 11<br />
Figure 2: Ownership of Disaster Effects........................................................................................................................................................ 12<br />
Figure 3: Share of Total Effects of TC Winston by Division............................................................................................................................ 12<br />
Figure 4: Geographical Distribution of Disaster Effects by Province.............................................................................................................. 13<br />
Figure 5: Geographical Distribution of Per Capita Disaster Effects................................................................................................................ 14<br />
Figure 6: Relationship between Per Capita Production Losses and Average Annual Household Income Arising from TC Winston................ 15<br />
Figure 7: TC Winston Track across <strong>Fiji</strong> (East to West)................................................................................................................................... 20<br />
Figure 8: Modelled Maximum Wind Speed from TC Winston over <strong>Fiji</strong>........................................................................................................... 21<br />
Figure 9: Quality of Life Weighted Indicators................................................................................................................................................ 22<br />
Figure 10: Pre-Disaster and Baseline GDP Forecast for 2015–2018............................................................................................................... 25<br />
Figure 11: Post-Disaster GDP Forecast 2015–2018....................................................................................................................................... 26<br />
Figure 12: Labour Force Classification, 2010/2011........................................................................................................................................ 30<br />
Figure 13: Incidence of Poverty in Urban and Rural Areas.............................................................................................................................. 30<br />
Figure 14: Social Protection Budget (2012–2015).......................................................................................................................................... 32<br />
Figure 15: Pre- and Post-Disaster Quality of Life Index by Province................................................................................................................ 42<br />
Figure 16: Most Affected Provinces in Terms of Decline in Quality of Life........................................................................................................ 43<br />
Figure 17: Decline in Quality of Life by Province............................................................................................................................................. 43<br />
Figure 18: Damage and Losses to Agriculture by Subsector (F$ million)......................................................................................................... 47<br />
Figure 19: Damage and Losses to the Agriculture Sector by Division (F$ million)............................................................................................ 47<br />
Figure 20: Quarterly Tourism Earnings 2012–2015......................................................................................................................................... 58<br />
Figure 21: Tourism Visitor Arrivals and Earnings for 2011–2015..................................................................................................................... 58<br />
Figure 22: Share of Damage and Losses in the Education Sector by Division................................................................................................. 64<br />
Figure 23: Total Damage and Losses in the Health Sector.............................................................................................................................. 68<br />
Figure 24: Damage to the Transport Sector by Subsector (F$ million)............................................................................................................ 79<br />
Figure 25: Damage to the Transport Sector by Division (F$ million)................................................................................................................. 80<br />
Figure 26: Damage Sites in the Central, Western and Eastern Divisions......................................................................................................... 80<br />
Figure 27: Damage Sites in the Northern and Eastern Divisions..................................................................................................................... 80<br />
Figure 28: Geographical Distribution of Recovery and Reconstruction (F$ million).......................................................................................... 82<br />
Figure 29: Damage, Losses and Needs by Division........................................................................................................................................ 83<br />
Figure 30: Damage to Major Environmental Assets (F$ million)....................................................................................................................... 95<br />
Figure 31: Hectares of Assets in Affected Areas............................................................................................................................................. 96<br />
Figure 32: Distribution of Mangroves and Coral Reefs in Cyclone-Affected Provinces..................................................................................... 97<br />
Figure 33: Losses to the Environment Sector by Division............................................................................................................................... 98<br />
Figure 34: Death Rate among Different Age Groups....................................................................................................................................... 101<br />
Figure 35: Summary of Damage and Losses Incurred at the Divisional Level.................................................................................................. 106<br />
Figure 36: National Disaster Management Structure...................................................................................................................................... 110<br />
Figure 37: Provinces Color Coded According to Wind Speed Intensity Levels................................................................................................ 145<br />
List of Textbox<br />
Box 1: Damage to Reef: Changing lives and livelihoods of people............................................................................................................ 98<br />
6 Tropical Cyclone Winston, February 20, 2016
FIJI Post-Disaster Needs Assessment<br />
Abbreviations and Acronyms<br />
ADB Asian Development Bank<br />
AFL Airports <strong>Fiji</strong> Limited<br />
BBB Building back better<br />
BNPL Basic Needs Poverty Line<br />
BQA Bilateral Quarantine Agreements<br />
CCA Climate change adaptation<br />
CBDRM Community-based disaster risk management<br />
CI<br />
Conservation International<br />
CIU Construction Implementation Unit<br />
CPA Child Protection Allowance<br />
CPS Care and Protection Scheme<br />
DoE Department of Energy<br />
DoF Department of Fisheries<br />
DFAT Department of Foreign Affairs and Trade<br />
DRF Disaster Recovery Framework<br />
DRFI Disaster Risk Finance and Insurance<br />
DRM Disaster risk management<br />
DRR Disaster risk reduction<br />
ESLP Employment, Livelihoods and Social Protection<br />
EU European Union<br />
EUS Employment and Unemployment Survey<br />
F$ <strong>Fiji</strong> dollar<br />
FAD Fish aggregating device<br />
FAO Food and Agriculture Organization of the UN<br />
FBOS <strong>Fiji</strong> Bureau of Statistics<br />
FCEF <strong>Fiji</strong> Commerce & Employers Federation<br />
FCOSS <strong>Fiji</strong> Council of Social Services<br />
FDPF <strong>Fiji</strong> Disabled Peoples Federation<br />
FEA <strong>Fiji</strong> Electricity Authority<br />
FIE <strong>Fiji</strong> Institute of Engineers<br />
FLMMA <strong>Fiji</strong> Locally Managed Marine Area<br />
FMS <strong>Fiji</strong> Meteorological Service<br />
FNPF <strong>Fiji</strong> National Provident Fund<br />
FPCL <strong>Fiji</strong> Ports Corporation Limited<br />
FRA <strong>Fiji</strong> Roads Authority<br />
FTUC <strong>Fiji</strong> Trades Union Congress<br />
FVP Food Voucher Program<br />
GDP Gross domestic product<br />
GFDRR Global Facility for Disaster Reduction and Recovery<br />
HART Housing Assistance Relief Trust<br />
HIES Household Income Expenditure Surveys<br />
ICOMOS International Council on Monuments and Sites<br />
ICT Information and communication technology<br />
IFC International Finance Corporation<br />
IUCN International Union for Conservation of Nature<br />
JICA Japan International Cooperation Agency<br />
MITT Ministry of Industry, Trade and Tourism<br />
MLGHE<br />
MoA<br />
MOE<br />
MoHMS<br />
MoIT<br />
MSAF<br />
MWCPA<br />
NCOP<br />
NDMC<br />
NDMO<br />
NEOC<br />
NGO<br />
NTDTKE<br />
PBS<br />
PCRAFI<br />
PDNA<br />
PLWD<br />
SGBV<br />
SME<br />
SPC<br />
SPO<br />
SPREP<br />
SPS<br />
TAG<br />
TC<br />
TFL<br />
TVET<br />
UNDP<br />
UNESCAP<br />
UNESCO<br />
UNFPA<br />
UNICEF<br />
USP<br />
VAT<br />
VGM<br />
WAF<br />
WB<br />
WASH<br />
WEBC<br />
WHO<br />
WCS<br />
YEC<br />
Ministry of Local Government, Housing and<br />
Environment<br />
Ministry of Agriculture<br />
Ministry of Education<br />
Ministry of Health and Medical Services<br />
Ministry of Infrastructure and Transport<br />
Maritime Safety Administration of <strong>Fiji</strong><br />
Ministry of Women, Children and Poverty Alleviation<br />
National Council of Older Persons<br />
National Disaster Management Council<br />
National Disaster Management Office<br />
National Emergency Operations Centre<br />
Non-governmental organization<br />
National iTaukei Database for Traditional Knowledge<br />
and Expressions<br />
Poverty Benefit Scheme<br />
Pacific Catastrophe Risk Assessment and Financing<br />
Initiative<br />
Post-Disaster Needs Assessment<br />
People living with disabilities<br />
Sexual and gender-based violence<br />
Small and medium enterprise<br />
Pacific Community<br />
Strategic Planning Office<br />
Secretariat of the Pacific Regional Environment<br />
Programme<br />
Social Pension Scheme<br />
Tourism Action Group<br />
Tropical Cyclone<br />
Telecom <strong>Fiji</strong> Limited<br />
Technical and Vocational Education Training<br />
United Nations Development Programme<br />
UN Economic and Social Commission for Asia and<br />
the Pacific<br />
United Nations Educational, Scientific and Cultural<br />
Organization<br />
United Nations Population Fund<br />
United Nations Children’s Fund<br />
The University of the South Pacific<br />
Value Added Tax<br />
Vatukoula Gold Mines<br />
Water Authority of <strong>Fiji</strong><br />
World Bank<br />
Water, sanitation and hygiene<br />
Women Entrepreneurs Business Council<br />
World Health Organization<br />
Wildlife Conservation Society<br />
Young Entrepreneurs Council<br />
7
FIJI Post-Disaster Needs Assessment<br />
Acknowledgments<br />
The Post-Disaster Needs Assessment (PDNA) is an extensive and labour-intensive exercise that would not have been<br />
possible without the dedication and support of the various ministries and departments of the Government of <strong>Fiji</strong> in providing<br />
the time of their staff and their accompanying expertise. Their drive and dedication underpins this government-led approach<br />
to disaster risk management and is a model for improved coordination while working together for a more resilient <strong>Fiji</strong>.<br />
Special acknowledgement is extended to the Attorney-General and Minister for Economy, Public Enterprises, Civil Service<br />
and Communications, Hon. Aiyaz Sayed-Khaiyum, and the Minister for Agriculture, Rural & Maritime Development<br />
and National Disaster Management, Hon. Inia Seruiratu, for their leadership, support and cooperation throughout the<br />
assessment.<br />
The PDNA team is grateful for the technical and financial support from the Africa Caribbean Pacific–European Union (ACP-<br />
EU) Natural Disaster Risk Reduction Program, the Asian Development Bank (ADB), the Australian Department of Foreign<br />
Affairs and Trade (DFaT), the Global Facility for Disaster Reduction and Recovery (GFDRR), the European Union (EU), the<br />
Pacific Community (SPC), the Secretariat of the Pacific Regional Environment Programme (SPREP), the United Nations<br />
(UN) and the World Bank Group, which provided the overall guidance for the PDNA process.<br />
The PDNA greatly benefitted from the dedicated involvement and valuable contribution by SPO staff and the following<br />
individuals: Roberto Jovel (Consultant, World Bank), Michael Bonte-Grapentin (Senior Disaster Risk Management Specialist,<br />
World Bank), Simone Esler (Disaster Risk Management Specialist, World Bank), Sirkka Killmann (Consultant, World Bank),<br />
Noud Leenders (Consultant, United Nations Development Programme), Andrew Parker (Principal Social Sector Economist,<br />
ADB), Christopher Wensely (Consultant, ADB), Jesús Laviña (Head of Infrastructure and Natural Resources, EU), Joanne<br />
Choe (Department of Foreign Affairs and Trade), and Mosese Sikivou (Coordinator, SPC Technical Support for TC Winston).<br />
8 Tropical Cyclone Winston, February 20, 2016
Navitilevu village, Ra Province, Viti Levu<br />
Source: Vlad Sokhin/World Bank<br />
EXECUTIVE SUMMARY<br />
9
FIJI Post-Disaster Needs Assessment<br />
On Saturday February 20, 2016, Tropical Cyclone (TC) Winston, an extremely destructive Category 5 cyclone, struck <strong>Fiji</strong>.<br />
TC Winston was the first Category 5 cyclone to directly impact <strong>Fiji</strong> and the most intense cyclone on record to affect the<br />
country. 1 <strong>Fiji</strong>’s Eastern Division was the first to be struck, with Koro, Ovalau and Taveuni Islands sustaining severe damage.<br />
The cyclone swept across <strong>Fiji</strong>’s islands, reaching its peak strength shortly before making landfall on the country’s largest<br />
island, Viti Levu. Maximum average wind speeds reached 233km/hour and wind gusts peaked at around 306km/hour,<br />
making Winston one of the most powerful cyclones ever recorded in the Southern Hemisphere. 2 In addition to the extreme<br />
wind speeds, many islands were flooded by storm surges, including Koro Island and the southern coast of <strong>Fiji</strong>’s secondlargest<br />
island, Vanua Levu, which was inundated almost 200 meters inland in some areas.<br />
Following TC Winston’s passage from <strong>Fiji</strong>, reports emerged of widespread damage and destruction, with the cyclone<br />
impacting approximately 540,400 people, equivalent to 62 percent of the country’s total population. 3 The storm brought<br />
down the power and communications systems linking the islands, with approximately 80 percent of the nation’s population<br />
losing power, including the entire island of Vanua Levu, and 44 fatalities were subsequently confirmed. Entire communities<br />
were destroyed and approximately 40,000 people required immediate assistance following the cyclone. 4 30,369 houses,<br />
495 schools and 88 health clinics and medical facilities were damaged or destroyed. In addition, the cyclone destroyed<br />
crops on a large scale and compromised the livelihoods of almost 60 percent of <strong>Fiji</strong>’s population.<br />
Summary of Damage and Losses<br />
The estimated value of disaster effects arising from TC Winston in <strong>Fiji</strong> is F$1.99 billion (US$0.9 billion), including F$1.29<br />
billion (US$0.6 billion) in damage (i.e., destroyed physical assets) and F$0.71 billion (US$0.3 billion) in losses. 5<br />
Table 1: Summary of Disaster Effects by Sector<br />
Disaster Effects (F$ million) Share of Disaster Effects a (%)<br />
Damage Losses Total Public Private<br />
Productive Sectors 241.8 594.5 836.3 12 88<br />
Agriculture 81.3 460.7 542.0 7 93<br />
Commerce and Manufacturing 72.9 69.9 142.8 49 51<br />
Tourism 76.1 43.9 120.0 100<br />
Mining 11.5 20.0 31.5 100<br />
Social Sectors 827.9 40.0 867.9 12 88<br />
Education 69.2 7.4 76.6 100<br />
Health 7.7 6.2 13.9 100<br />
Housing 751.0 26.4 777.4 2 98<br />
Infrastructure Sectors 208.2 40.4 248.6 84 16<br />
Transport 127.1 2.4 129.5 98 2<br />
Water and Sanitation 16.9 7.9 24.8 100<br />
Electricity 33.0 8.1 41.1 100<br />
Communications 31.2 22.0 53.2 30 70<br />
Cross-Cutting Issues 239.6 660.1 899.7 4 96<br />
Environment b 232.5 629.8 862.3 100<br />
1<br />
<strong>Fiji</strong> Meteorological Service<br />
2<br />
These preliminary figures are from the <strong>Fiji</strong> Meteorological Service.<br />
3<br />
Population and Labour Force Estimates, 2014.<br />
4<br />
<strong>Fiji</strong>: Severe Tropical Cyclone Winston Situation Report No. 11 (as of 3 March 2016) (PDF) (Situation Report). ReliefWeb. United Nations<br />
Office for the Coordination of Humanitarian Affairs. Retrieved March 3, 2016.<br />
5<br />
These figures exclude the environment sector, as environmental assets and flows of environmental services are not included in the<br />
national accounts.<br />
10 Tropical Cyclone Winston, February 20, 2016
FIJI Post-Disaster Needs Assessment<br />
Disaster Effects (F$ million) Share of Disaster Effects a (%)<br />
Damage Losses Total Public Private<br />
Culture and Heritage 5.1 0.8 5.9 23 77<br />
Disaster Risk Management 2.0 29.5 31.5 100<br />
Total (Excluding Environment c ) 1,285.0 705.2 1,990.2 78 22<br />
Grand Total 1,517.5 1,335.0 2,852.5 84 16<br />
Source: Estimations by Assessment Team.<br />
a. A breakdown of the public/private ownership for damage and loss (rather than the cumulative breakdown for disaster effects) is provided<br />
in Annex 1.<br />
b. Estimation of environmental losses include ecosystem service losses for 2016-18 for native forests, mangroves and coral reefs. Total<br />
recovery time may stretch beyond this timeframe.<br />
c. These figures exclude the environment sector, as environmental assets and flows of environmental services are not included in the<br />
national accounts.<br />
The combined value of destroyed assets and disruptions in the production of goods and services is equivalent to about<br />
one fifth of the country’s 2014 gross domestic product (GDP). TC Winston will, therefore, have a significant negative impact<br />
on the overall performance of the national economy and likewise on the quality of life.<br />
TC Winston produced different effects across the various sectors, with the most significant impacts felt by the productive<br />
and social sectors. The individual sectors that sustained the greatest damage were housing, accounting for 58 percent of<br />
total damage costs, followed by transport, accounting for 10 percent of all damage. The highest level of production losses<br />
are expected in the agriculture sector and is estimated at 65 percent of total losses. The housing sector suffered the highest<br />
total effects from TC Winston (including both damage and losses), accounting for 39 percent of the total. 6<br />
If the value of destroyed environmental assets and losses in environmental services is added in, the total effects of the<br />
disaster reach F$2.85 billion (US$1.3 billion), with F$1.52 billion in damage (US$0.7 billion) and F$1.34 billion in losses<br />
(US$0.6 billion).<br />
While the impacts of TC Winston are felt by all sectors, the consequences for the agriculture sector in particular are<br />
expected to last for several years due to continued production losses and associated higher production costs. High winds,<br />
flooding and storm surges have imposed substantial damage to permanent plantations for, which will need to be replanted,<br />
as well as damage to mangrove forests and coral reefs, which provide a habitat for fish species that have been forced to<br />
migrate. This means that those who work in the fisheries sector are unable to capture the same volume as before.<br />
200<br />
Production loses, million F$<br />
150<br />
100<br />
50<br />
0<br />
2016 2017 2018 2019 2020 2021<br />
Agriculture crops<br />
Livestock<br />
Fishery<br />
Figure 1: Projected Production Losses in the Agriculture Sector over Time<br />
Source: Estimations by Assessment Team.<br />
6<br />
These figures exclude the environment sector, as environmental assets and flows of environmental services are not included in the<br />
national accounts.<br />
Tropical Cyclone Winston, February 20, 2016<br />
11
FIJI Post-Disaster Needs Assessment<br />
In some cases, production will not return to pre-disaster levels for five to 10 years. In the meantime, people’s incomes will<br />
decline significantly in the affected areas. Figure 1 shows the time variation of production losses from TC Winston for the<br />
agriculture sector, including the subsectors of crops, livestock and fisheries. These production losses will also negatively<br />
impact on activities of the manufacturing and trade sectors due to their linkages through the food production chain.<br />
Data collected provides evidence that private sector damage and losses from Winston far exceed those sustained in the<br />
public sector, accounting for 78 percent of all damage and losses (Figure 2). Such information provides an idea of the<br />
relative efforts that the government and private entities will be required to undertake as part of recovery and reconstruction.<br />
1,800<br />
1,600<br />
1,400<br />
F$ (million)<br />
1,200<br />
1,000<br />
800<br />
600<br />
400<br />
200<br />
0<br />
Public<br />
Private<br />
Damage<br />
Losses<br />
Figure 2: Ownership of Disaster Effects<br />
Source: Estimations by Assessment Team.<br />
Damage and losses were highest in the Western Division (49 percent of total disaster effects) and in the Northern Division<br />
(28 percent), while the Central and Eastern Divisions were affected to a lesser degree (Figure 3).<br />
12%<br />
49%<br />
11%<br />
Central<br />
Eastern<br />
Northern<br />
Western<br />
28%<br />
Figure 3: Share of Total Effects of TC Winston by Division<br />
Source: Estimations by Assessment Team.<br />
Table 2 and Figure 4 show the estimated values of disaster effects by province. The province of Ba was the most affected,<br />
with a total value of damage and losses of F$668 million, which constitutes 34 percent of the national total. Ra and<br />
Cakaudrove provinces were also significantly affected, suffering around F$315 million in total effects each.<br />
12 Tropical Cyclone Winston, February 20, 2016
12 <br />
FIJI Post-Disaster Needs Assessment<br />
Table 2: Total Damage and Production Losses Caused by TC Winston by Province (F$ million)<br />
Province Damage Production Losses Total Effects<br />
Ba 526.0 142.0 668.1<br />
Ra 230.8 86.1 316.9<br />
Cakaudrove 183.2 131.5 314.7<br />
Bua 57.4 94.0 151.3<br />
Lomaiviti 102.3 45.5 147.8<br />
Tailevu 53.9 66.8 120.7<br />
Naitasiri 43.3 29.2 72.5<br />
Macuata 15.5 28.1 43.5<br />
Lau 23.5 13.3 36.8<br />
Nadroga/Navasa 16.4 18.5 34.9<br />
Rewa 5.6 2.5 8.1<br />
Serua 1.3 1.1 2.3<br />
Namosi 1.2 0.9 2.1<br />
Source: Estimations by Assessment Team.<br />
Table 2 and <br />
Western<br />
49%<br />
Central<br />
12%<br />
Eastern<br />
11%<br />
Northern<br />
28%<br />
Figure 3: Share of Total Effects of TC Winston by Division <br />
Figure 4: Geographical Distribution of Disaster Effects by Province<br />
Figure 4 show the estimated values of disaster effects by province. The province of Ba was the most <br />
affected, with a total value of damage and losses of F$668 million, which constitutes 34 percent of <br />
the national total. Ra and Cakaudrove provinces were also significantly affected, suffering around <br />
Source: Estimations by Assessment Team.<br />
Table 3 below shows the average value of disaster effects sustained by the people residing in each of the affected provinces.<br />
People F$315 living in million Ra, Bua in and total Lomaiviti effects sustained each. per capita disaster effects of between F$8,500 and just over F$10,000,<br />
which represents a significant proportion of household income. Residents of Cakaudrove were also significantly affected, at<br />
a per capita level of F$6,000, followed by residents of Lau and Tailevu who sustained per capita effects between F$3,200<br />
and F$2,000. 7 In terms of damage, people living in Ra Province sustained the highest damage (F$7,400/person), while in<br />
terms of losses, the population of Bua Province sustained higher levels of damage (F$6,200/person).<br />
Table 2: Total Damage and Production Losses Caused by TC Winston by Province (F$ million) <br />
Province Damage Production Losses Total Effects <br />
Ba 526.0 142.0 668.1 <br />
Ra 230.8 86.1 316.9 <br />
Tropical Cyclone Winston, February 20, 2016<br />
13
FIJI Post-Disaster Needs Assessment<br />
Table 3: Estimated Value of Per Capita Disaster Effects per Province (F$/person)<br />
Province Damage Production Losses Total Effects<br />
Ra 7,368 2,747 10,115<br />
Bua 3,786 6,204 9,990<br />
Lomaiviti 5,915 2,629 8,544<br />
Cakaudrove 3,491 2,505 5,996<br />
Lau 2,054 1,164 3,218<br />
Ba 2,153 581 2,734<br />
Tailevu 915 1,133 2,048<br />
Nadroga/Navasa 266 299 565<br />
Naitasiri 257 173 430<br />
Namosi 165 124 289<br />
Serua 67 55 122<br />
Rewa 53 24 77<br />
Namosi 1.2 0.9 2.1<br />
Source: Estimations by Assessment Team.<br />
The map in Figure 5 shows the estimated values of per capita disaster effects in the affected provinces.<br />
Figure 5: Geographical Distribution of Per Capita Disaster Effects<br />
Source: Estimations by Assessment Team.<br />
Figure : eograhical Distribution of Per Caita Disaster Effects <br />
A comparison made of estimated per capita production losses with average annual household income (Figure 6) reveals<br />
that TC Winston ource has stimations affected the by most ssessment impoverished Team. population strata of the country, which should inform recovery<br />
and reconstruction priorities. The population in the northern provinces of Bua and Cakaudrove (where average annual<br />
household income is F$14,100/per person) have sustained the greatest production losses.<br />
comparison made of estimated per capita production losses with average annual <br />
7<br />
household Despite income the fact that Figure Ba Province 6 is reveals where the highest that value TC of inston damage and losses has occurred, affected the per capita the disaster most effects impoverished for Ba <br />
residents are only of intermediate value, i.e., 2,700 F$/person.<br />
population strata of the country, which should inform recovery and reconstruction <br />
priorities. 14 Tropical The Cyclone population Winston, February in 20, the 2016 northern provinces of Bua and Cakaudrove where average <br />
annual household income is F$14,100per person have sustained the greatest production
FIJI Post-Disaster Needs Assessment<br />
Per capita production losses, F$/person<br />
8,000<br />
7,000<br />
6,000<br />
5,000<br />
4,000<br />
3,000<br />
2,000<br />
1,000<br />
0<br />
Bua<br />
Lomaiviti<br />
Ra<br />
Cakaudrove<br />
Lau<br />
0 5,000 10,000 15,000 20,000 25,000 30,000 35,000<br />
Average Annual Household Income, F$<br />
Figure 6: Relationship between Per Capita Production Losses and Average Annual Household Income Arising from TC<br />
Winston<br />
Source: Estimations by Assessment Team.<br />
Note: The sizes of the balls in the above figure represent the ratio between production losses and household income.<br />
Summary of Economic and Social Impact<br />
Summary of Economic Impact<br />
The macroeconomic impact of TC Winston in 2016 is expected to be substantial given the significant damage incurred,<br />
particularly to key sectors, such as housing, transport, manufacturing, agriculture, electricity and communications. The<br />
losses resulting from TC Winston are estimated to reduce economic growth by 2.5 percent relative to the 2016 pre-cyclone<br />
forecast, bringing the growth rate down from 3.8 percent to 1.3 percent. However, taking into account the possible effect<br />
of recovery and reconstruction activities, assuming they start during 2016, the GDP growth rate is expected to be 2.4<br />
percent, which is a decrease of 1.4 percent compared to the pre-cyclone baseline estimate. This revised growth also<br />
reflects the expected impact of TC Zena, which passed southeast of <strong>Fiji</strong> only six weeks after TC Winston, causing torrential<br />
rain and major flooding.<br />
The impact of TC Winston on the performance of the balance-of-payments in 2016 will be quite substantial, due to exports<br />
declining relative to pre-cyclone forecasted levels. Total exports are now projected to decline by 1.2 percent in 2016<br />
compared to over 17 percent growth anticipated prior to the cyclone. Imports will be higher than previously expected<br />
with an inflow of machinery, equipment and materials for reconstruction and replacement of infrastructure in the housing,<br />
education, telecommunication and transport sectors. Food imports are also expected to increase due to the loss of locally<br />
grown produce. These impacts will raise the trade in goods deficit by 18.5 percent this year, which, as a percent of GDP,<br />
is now estimated to increase from 27.3 percent to 32.4 percent in 2016. The cyclone had minimal impact on the tourism<br />
sector, which is expected to fully recover during 2016. Aid in-kind and cash grants have risen following the cyclone and<br />
reconstruction financing is expected to result in higher inflows during 2016 and beyond. Overall, <strong>Fiji</strong>’s Balance of Payments<br />
Current Account deficit for 2016 is estimated to increase by 8.9 percent, driven by lower export earnings and higher import<br />
payments. This will raise the Current Account deficit to 12.9 percent of GDP (at market price) in 2016.<br />
There will be a number of negative impacts on the government’s fiscal balance. Government expenditure on disaster relief<br />
and early recovery activities are being funded through the reprioritization of line ministry budgets. Notable reallocations<br />
include top ups for social welfare programmes and food ration distribution. In addition, around F$70 million will be set<br />
aside for the upcoming residential rehabilitation and assistance programme (Help for Homes), and the diversion of funds<br />
into relief, recovery and reconstruction will reduce funds available for the government’s existing development programmes.<br />
Large additional expenditures are expected to be required once the reconstruction and recovery programmes are fully<br />
specified. In terms of impacts on revenue, value added tax (VAT) collections are expected to decline by about F$61.9 million<br />
during 2016 and there will be reductions in the Service Turnover Tax as a result of losses in the tourism sector.<br />
Tropical Cyclone Winston, February 20, 2016<br />
15
FIJI Post-Disaster Needs Assessment<br />
Summary of Social Impact<br />
TC Winston affected approximately 540,400 people, or approximately 62 percent of <strong>Fiji</strong>’s total population (estimated to<br />
be 865,611 at the end of 2014), 8 resulting in estimated losses of 14,450,129 work days and F$351.45 million in personal<br />
income. The largest proportion of the affected population was in the Western Division, followed by the Central, Northern<br />
and Eastern Divisions. An estimated 263,000 women may have been affected by the disaster. 9<br />
Table 4: Population Affected by TC Winston<br />
Division Deaths Missing Hospitalised Injured<br />
Number<br />
of people<br />
affected due<br />
to loss of<br />
livelihood of<br />
main bread<br />
winner<br />
Number<br />
of people<br />
displaced<br />
Total number<br />
of people<br />
affected<br />
Central 6 2 24 162,698 5245 167,975<br />
Eastern 22 1 3 59 30,222 7595 37,902<br />
Northern 3 5 10 93,488 10210 103,716<br />
Western 13 17 24 198,622 32145 230,821<br />
Total 44 1 27 117 485,030 55,195 540,414<br />
Source: Estimates based on Government of <strong>Fiji</strong> data.<br />
The affected population is comprised of: (i) those who lost their lives, were injured or fell ill as a result of the cyclone<br />
(which together accounted for approximately 0.03 percent of the total affected population); (ii) those who were displaced,<br />
including those whose homes were totally destroyed (which accounted for approximately 10 percent of the total affected<br />
population); and (iii) those whose livelihoods were affected (which accounted for almost 90 percent of the total affected<br />
population). In terms of livelihoods affected, 57 percent relate to the agricultural sector, 17 percent to commerce, 10<br />
percent to manufacturing, and 8 percent to tourism and transportation equally.<br />
Overall, the government’s social protection measures in response to TC Winston have translated into a financial contribution<br />
of F$344.7 million. In terms of impact on the population, the disaster may result in increasing subsistence economic activity,<br />
widening income inequality, deepening poverty, new challenges to social protection measures in light of increasing demand<br />
for support, and reduced entrepreneurial confidence among small and medium-sized enterprises required for job creation<br />
and entrepreneurship.<br />
Summary of Recovery and Reconstruction<br />
Needs<br />
Based on damage, losses and identified needs, and in order to promote social, economic, cultural and environmental<br />
wellbeing over the next two years, key recovery and reconstruction activities can be classified around the following themes:<br />
<br />
<br />
<br />
<br />
Production Recovery, which includes recovery of production levels in the productive sectors of agriculture (crops,<br />
fishery and livestock), commerce and manufacturing, mining and tourism.<br />
Service Supply and Access Recovery, focused on recovery of supply and access to basic services of education,<br />
health, housing, transport, communications, water supply and sanitation, and electricity.<br />
Personal and Household Income Recovery, with a focus on improving the livelihoods of those affected (i.e.,<br />
through cash for work schemes, or training to facilitate the ability to generate diversified household income),<br />
particularly those who have lost income, and are vulnerable and below the poverty level.<br />
Reconstruction, or recovery of physical assets including infrastructure and buildings, in adherence to the principles<br />
of building back better.<br />
8<br />
Population and Labour Force Estimates 2014.<br />
9<br />
Population and Labour Force Estimates 2014 reported that women comprise 48.8 percent of the population.<br />
16 Tropical Cyclone Winston, February 20, 2016
FIJI Post-Disaster Needs Assessment<br />
Table 5 summarizes the estimated financial requirements to achieve overall recovery, reconstruction and resilience in<br />
affected sectors. Total costs are estimated at F$1.96 billion (US$0.9 billion). Of this amount, F$0.22 billion (US$0.1 billion)<br />
will focus on recovery needs, F$1.71 billion (US$0.8 billion) will focus on reconstruction and F$31 million (US$14 million)<br />
will focus on resilience activities.<br />
Table 5: Recovery and Reconstruction Needs by Sector (F$ million)<br />
Recovery Reconstruction Resilience Total<br />
Productive Sectors 94.1 173.6 267.7<br />
Agriculture 65.3 96.1 161.4<br />
Commerce and Manufacturing 17.8 43.5 61.3<br />
Tourism 5.0 29.0 34.0<br />
Mining 6.0 5.0 11.0<br />
Social Sectors 12.4 1,261.7 1,274.1<br />
Education 385.9 385.9<br />
Health 12.1 18.8 30.9<br />
Housing 0.3 857.0 857.3<br />
Infrastructure Sectors 15.3 250.7 18.8 284.8<br />
Transport 3.2 174.7 177.9<br />
Water and Sanitation 3.6 20.7 24.3<br />
Electricity 2.1 25.9 5.8 33.8<br />
Communications 6.4 29.4 13.0 48.8<br />
Cross-Cutting Issues 63.0 27.4 12.0 99.7<br />
Environment 60.8 13.1 73.9<br />
Gender 1.6 0.4 2.0<br />
Culture and Heritage 0.6 8.5 9.1<br />
Disaster Risk Management 2.7 12.0 14.7<br />
ELSP 31.5 31.5<br />
Total 216.3 1,713.4 30.8 1,957.8<br />
Source: Estimations by Assessment Team.<br />
Way Forward<br />
Recovery needs identified during the Post-Disaster Needs Assessment process are driven by the sectoral needs analyses,<br />
but do not necessarily link to the availability or form of recovery funding. Given the extent of identified needs and the limited<br />
resources, the first step is to prioritize the sectors for recovery and reconstruction, based on the available financial envelope<br />
and a number of strategic considerations. A criteria-based prioritization of recovery needs across competing sectors will be<br />
undertaken, the principles of which may include the following:<br />
<br />
<br />
<br />
<br />
<br />
<br />
<br />
<br />
<br />
<br />
The recovery programme will be implemented under the government’s leadership, in close and collaborative partnership<br />
with international donors, the private sector, civil society and the community as a whole. It will be guided by a detailed<br />
Disaster Recovery Framework that will provide guidance for the coordinated recovery and reconstruction efforts.<br />
Tropical Cyclone Winston, February 20, 2016<br />
17
1.<br />
Namuaimada village, Ra Province, Viti Levu<br />
Source: Vlad Sokhin/World Bank<br />
INTRODUCTION<br />
18 Tropical Cyclone Winston, February 20, 2016
FIJI Post-Disaster Needs Assessment<br />
1.1 Disaster Risk Profile of <strong>Fiji</strong><br />
<strong>Fiji</strong> is located in the tropical cyclone belt, experiencing frequent cyclones characterized by damaging winds, rain and storm<br />
surges, and, on average, one cyclone per year. It is also situated in a relatively quiet seismic area, but is surrounded by the<br />
Pacific Ring of Fire, which aligns with the boundaries of the tectonic plates and is associated with extreme seismic activity,<br />
volcanic activity, strong earthquakes and tsunamis. In addition, the country suffers from extreme events associated with<br />
climate variability, including sea-level rise, temperature extremes and droughts.<br />
In the past few decades, <strong>Fiji</strong> has been affected by multiple devastating cyclones. In 2012 alone, <strong>Fiji</strong> experienced two<br />
major flooding events and one tropical cyclone (Evan). The effects of natural disasters in <strong>Fiji</strong> are far reaching, negatively<br />
impacting on, among other sectors, agriculture, housing, transport infrastructure, tourism and primary industries. Since<br />
1980, disaster events in <strong>Fiji</strong> have resulted in average annual economic damage of around F$35 million and impacted<br />
around 40,000 people each year. In the same period, at least 186 people were killed by flooding and storm events alone.<br />
<strong>Fiji</strong> is expected to incur, on average, F$158 million (US$85 million) per year in losses due to earthquakes and tropical<br />
cyclones. In the next 50 years, <strong>Fiji</strong> has a 50 percent chance of experiencing a loss exceeding F$1.5 billion (US$806 million),<br />
and a 10 percent chance of experiencing a loss exceeding F$3 billion (US$1.6 billion). 10 However, these figures may<br />
increase once the impacts of climate change are taken into consideration.<br />
1.2 Socioeconomic Context of <strong>Fiji</strong><br />
<strong>Fiji</strong> is an archipelago of 332 islands (of which approximately 110 are inhabited), spread over a land area of approximately<br />
18,300km 2 and a geographic area of almost 50,000km 2 . The country’s population of approximately 865,000 11 resides<br />
primarily on the two largest islands, Viti Levu and Vanua Levu. <strong>Fiji</strong> is the second largest country in the region after Papua<br />
New Guinea.<br />
<strong>Fiji</strong> is geographically and culturally the centre of the Pacific, and has historically served as a regional hub for banking<br />
services and communications, as well as for flights and shipping to other Pacific islands. <strong>Fiji</strong> is one of the wealthier countries<br />
in the Pacific, with a gross domestic product (GDP) of US$4.53 billion and a gross national income of US$4,870 per<br />
capita (World Bank 2014). Economic growth has been strong in recent years, reaching 3.6 percent in 2013, 5.3 percent<br />
in 2014 and an estimated 4 percent in 2015, which is significantly above the 2 percent average for the period 1980–2012.<br />
Strong credit growth, buoyant remittances and improved labour market conditions have boosted consumer demand, and<br />
strong visitor arrivals and government spending on infrastructure also supported the above-trend growth. The economy is<br />
primarily based on agriculture, sugar and tourism, with tourism being the largest foreign exchange earner over the years.<br />
Despite its larger size and positioning within the Pacific, <strong>Fiji</strong> faces some of the geographic and structural challenges<br />
common to other smaller Pacific island countries, including remaining vulnerable to external shocks and natural disasters.<br />
Remoteness, in conjunction with internal dispersion, imposes additional trade- and transportation-related costs. These<br />
same factors also increase the cost and complexity of providing public services and fulfilling some basic government<br />
functions.<br />
While the country has achieved broad coverage in the provision of basic social services, 35 percent of <strong>Fiji</strong>ans live below<br />
the basic needs poverty line. 12 Although poverty has recently declined, a significant rural-urban variation remains, with 44<br />
percent of the rural population living in poverty, compared to 26 percent of the urban population. Enrolment in primary<br />
education is almost universal, with a primary net enrolment rate of 96.8 percent.<br />
1.3 Tropical Cyclone Winston<br />
On Saturday February 20, 2016, Tropical Cyclone (TC) Winston struck <strong>Fiji</strong> as an extremely destructive Category 5 cyclone,<br />
the first such cyclone to directly impact <strong>Fiji</strong> and the most intense to ever to hit the country. Prior to the cyclone making<br />
landfall, the disaster management machinery was set in motion with the activation of the National Emergency Operations<br />
Centre (NEOC) and Divisional Emergency Operation Centres. Evacuation centres were opened in anticipation of people<br />
requiring shelter. The Regional Specialized Meteorological Centre in Nadi issued special media releases, identifying areas<br />
in Winston’s path that could expect destructive hurricane force winds, and riverine and coastal flooding of low-lying areas.<br />
10<br />
These figures are based on modelling from PCRAFI (2015).<br />
11<br />
Population and Labour Force Estimates 2014.<br />
12<br />
Data from the 2013/2014 HIES.<br />
Tropical Cyclone Winston, February 20, 2016<br />
19
FIJI Post-Disaster Needs Assessment<br />
<strong>Fiji</strong>’s Eastern Division was the first to be struck, with Koro, Ovalau and Taveuni Islands sustaining severe damage. The<br />
cyclone swept across <strong>Fiji</strong>’s islands, reaching its peak strength shortly before making landfall on the country’s largest island,<br />
Viti Levu, which has a population of 600,000. Maximum average wind speeds reached 233km/hour and wind gusts peaked<br />
at around 306km/hour, making Winston one of the most powerful cyclones ever recorded in the Southern Hemisphere. 13<br />
Many islands were struck by storm surges, including Koro Island and the southern coast of <strong>Fiji</strong>’s second-largest island,<br />
Vanua Levu, which occurred almost 200m inland.<br />
Legend<br />
Winston Position<br />
Winston Track<br />
Hurricane<br />
Storm<br />
Gale<br />
Figure 7: TC Winston Track across <strong>Fiji</strong> (East to West)<br />
Source: Preliminary <strong>Fiji</strong> Met briefing.<br />
Following TC Winston’s passage from <strong>Fiji</strong>, widespread damage and destruction was reported, and approximately 540,400<br />
people were impacted by the cyclone or approximately 62 percent of the population. 14 The storm brought down the power<br />
and communications systems linking the islands, with approximately 80 percent of the nation’s population losing power,<br />
including the entire island of Vanua Levu. This hampered initial efforts to obtain a comprehensive understanding of the full<br />
scale of the disaster’s impacts.<br />
Forty-four fatalities were subsequently confirmed, entire communities were destroyed and approximately 40,000 people<br />
required immediate assistance following the cyclone. 15 30,369 houses, 495 schools, and 88 health clinics and medical<br />
facilities were damaged or destroyed, and crops were destroyed on a large scale, compromising the livelihoods of almost<br />
60 percent of <strong>Fiji</strong>’s population.<br />
1.4 Response from the Government and<br />
Development Partners<br />
A state of natural disaster was declared by the Government of <strong>Fiji</strong> for the Central, Western, Eastern and Northern Divisions<br />
on February 20, 2016. Following the event, the government declared a state of emergency, and has been leading response<br />
efforts, which are being coordinated by nine national humanitarian clusters 16 led by government ministries. Humanitarian<br />
partners, international and national non-governmental organizations (NGOs), foreign governments, donors and civil<br />
society are also supporting the government-led response. The government has implemented a range of social protection<br />
programmes to support households, including the provision of additional funds to households via the Poverty Benefit<br />
Scheme, the Food Voucher Programme and the Help for Homes initiative, which will provide affected households with<br />
vouchers for housing rehabilitation and reconstruction.<br />
13<br />
These preliminary figures are from the <strong>Fiji</strong> Meteorological Service.<br />
14<br />
Population and Labour Force Estimates 2014.<br />
15<br />
<strong>Fiji</strong>: Severe Tropical Cyclone Winston Situation Report No. 11 (as of 3 March 2016) (PDF) (Situation Report). ReliefWeb. United Nations<br />
Office for the Coordination of Humanitarian Affairs. Retrieved 3 March 2016.<br />
16<br />
The national humanitarian clusters are: Communications; Education; Food Security and Livelihoods; Health and Nutrition; Logistics;<br />
Public Works and Utilities; Shelter; Safety and Protection; and WASH.<br />
20 Tropical Cyclone Winston, February 20, 2016
FIJI Post-Disaster Needs Assessment<br />
Figure 8: Modelled Maximum Wind Speed from TC Winston over <strong>Fiji</strong><br />
Source: Pacific Catastrophe Risk Assessment and Financing Initiative (PCRAFI) event brief, March 2016.<br />
To assess the socioeconomic impact of TC Winston, and assist in mobilizing the resources needed for recovery and<br />
reconstruction, the Government of <strong>Fiji</strong> requested that a Post-Disaster Needs Assessment (PDNA) be conducted. As part of<br />
agreements on post-crisis cooperation, the assessment was supported by the European Union, United Nations (UN) and<br />
World Bank, as well as other regional organizations and bilateral partners, including the Asian Development Bank (ADB),<br />
and the government of Australia, the Secretariat of the Pacific Community (SPC) and the Secretariat of the Pacific Regional<br />
Environmental Programme (SPREP).<br />
This PDNA will form the basis of the Disaster Recovery Framework (DRF) to be prepared by the Government of <strong>Fiji</strong>, which<br />
will guide recovery and reconstruction within all sectors affected by TC Winston.<br />
1.5 Post-Disaster Needs Assessment<br />
Methodology<br />
The PDNA is an approach to analyzing disaster effects and impacts for the purpose of identifying recovery needs, as they<br />
are understood from human, sociocultural, economic and environmental perspectives. A unique aspect of the PDNA is that<br />
it is led and owned by the government of the affected country with assistance from a multidisciplinary, multiagency team.<br />
In this instance, the PDNA team included the World Bank Group, the Global Facility for Disaster Reduction and Recovery<br />
(GFDRR), UN agencies, the ADB, SPC and other relevant stakeholders. The assessment methodology used is based on<br />
the PDNA guidelines (GFDRR, 2013), and has three main elements: assessment of disaster effects, assessment of disaster<br />
impact, and recovery strategy and needs.<br />
Tropical Cyclone Winston, February 20, 2016<br />
21
FIJI Post-Disaster Needs Assessment<br />
1.5.1 Assessment of Disaster Effects<br />
Under the PDNA methodology, assessment of the disaster effects is based on a bottom-up approach, captures information<br />
about the effects of the event sector by sector, and aggregates the data to determine the event’s total effects on society<br />
and the economy. Assessment of disaster effects is based on the quantification of damage and losses.<br />
<br />
<br />
<br />
assets either totally or partially destroyed by the disaster.<br />
<br />
production decline and higher production costs. Losses occur until full economic recovery and reconstruction are<br />
achieved, which can, in some cases, take several years. Typical losses include the decline in output in productive<br />
sectors (i.e., agriculture, industry, commerce, mining and tourism), as well as the decline in delivery of basic services<br />
(such as education, health, electricity, water and sanitation).<br />
1.5.2 Assessment of Disaster Impact<br />
Within the PDNA methodology, disaster impact is defined as the consequences of disaster effects on economic and social<br />
development. Therefore, disaster impact is measured at the macroeconomic, macrosocial and household levels.<br />
<br />
<br />
<br />
and the temporary macroeconomic imbalances that may arise from the disaster, in the external and fiscal sectors<br />
of the economy.<br />
<br />
employment, as well as gender-specific impacts.<br />
1.5.3 Quality of Life<br />
TC Winston has not only had a significant negative<br />
impact on the national economy, but it has also caused<br />
an immediate and prolonged decline in the quality of life<br />
and wellbeing of affected households and communities.<br />
Existing sectoral baseline information and the estimated<br />
value of the main disaster effects were used to estimate<br />
sectoral indicators that define quality of life. The quality of<br />
life index is a composite index conceived to:<br />
per capita GDP<br />
per person<br />
Number of<br />
houses available<br />
Number of<br />
patients treated<br />
in hospital<br />
1. Comprehensively and quantitatively measure the<br />
disaster’s impact on quality of life through a set of<br />
key socioeconomic indicators;<br />
2. Identify the geographical location and demographic<br />
characteristics of the most affected population in<br />
order to assist decision makers in prioritizing and<br />
targeting prospective recovery interventions; and<br />
3. Provide a readily available post-disaster baseline<br />
that will enable national authorities and international<br />
partners to periodically monitor the improvement<br />
(or indeed further deterioration) of the quality of life<br />
during the recovery and reconstruction process. 17<br />
Number of<br />
households<br />
connected to<br />
collective water<br />
supply and<br />
sanitation<br />
systems<br />
Quality of Life<br />
Index<br />
Number of<br />
households<br />
connected to<br />
electricity<br />
grid<br />
Number of<br />
attended school<br />
days<br />
The quality of life index is composed of several equally<br />
weighted indicators that are assessed prior to the disaster,<br />
immediately after the disaster, and periodically during the<br />
recovery and reconstruction process (see Figure 9).<br />
Figure 9: Quality of Life Weighted Indicators<br />
Source: Roberto Jovel.<br />
The composite quality of life index derived for the case of TC Winston focuses on recovery priorities in several ways.<br />
It provides a measure of negative disaster impacts on the affected population’s living conditions, shows the impact’s<br />
geographical distribution, and provides a quantitative means to measure progress in achieving recovery over time. The<br />
quality of life index may be reevaluated periodically to determine progress in achieving recovery and reconstruction.<br />
17<br />
For more detail on the quality of life index, refer to Chapter 2.4 of this PDNA.<br />
22 Tropical Cyclone Winston, February 20, 2016
FIJI Post-Disaster Needs Assessment<br />
1.5.4 Recovery and Reconstruction Strategy and Needs<br />
Assessments of disaster effects and disaster impacts collectively assist with the determination of recovery needs under<br />
the PDNA methodology, and incorporate the concept of “building back better” (BBB). 18 The Government of <strong>Fiji</strong> has publicly<br />
reiterated the importance of BBB to avoid such effects from similar disaster events in the near future. BBB has been<br />
selectively applied across and within sectors to ensure a cost-optimized, multi-hazard reconstruction.<br />
The identified recovery needs form the basis for determining recovery, reconstruction and resilience interventions through<br />
a recovery strategy. Accordingly, the PDNA’s main goal is to assist governments in assessing the full extent of a disaster’s<br />
impact on the country and, on the basis of these findings, to produce an actionable and sustainable recovery strategy for<br />
mobilizing financial and technical resources.<br />
Financial requirements for recovery and reconstruction are estimated as a function of the values of destroyed assets,<br />
changes in the flows of the economy, and the decline in personal or household income, obtained in the assessment of<br />
disaster effects, as follows.<br />
<br />
<br />
<br />
equivalent to the amounts of working capital required by producers to achieve recovery of production levels. The<br />
needs for recovery in the services sectors (education, health, culture, transport, communications, electricity, and<br />
water and sanitation) are the amounts required to restore supply to, and access by, the population. The estimation<br />
of personal or household income decline, arising from the previously estimated drop in production at sectoral<br />
levels, is used to determine the possible financial requirements for “cash-for-work” and other income-assistance<br />
programmes for the affected population. Recovery needs typically have a value that is equivalent to a fraction of the<br />
value of estimated losses in sectoral production combined with higher costs of production.<br />
<br />
to incorporate an additional cost for improved, disaster-resilient standards, which adhere to the principles of BBB.<br />
Reconstruction needs are usually slightly higher than the estimated value of damage or destruction of assets, as<br />
rebuilding will include the introduction of disaster-resilient design and construction standards.<br />
For both recovery and reconstruction needs, the value of any existing insurance proceeds should be deducted.<br />
1.5.5 Specific Context of this PDNA<br />
The geographical context of this PDNA covers all four divisions of <strong>Fiji</strong> (Central, Eastern, Northern and Western), as all were<br />
impacted by TC Winston. Annex 9: Map of <strong>Fiji</strong> provides a map of <strong>Fiji</strong> that clearly shows all the divisions.<br />
1.5.6 Limitations of this Assessment<br />
This assessment was completed 65 days after TC Winston, and reports only on data received at the time of writing.<br />
Undertaking field surveys was hindered due to flooding and the threat of TC Zena during 6-7 April 2016. This had some<br />
impact on the collection of damage and loss data, particularly for the commerce and manufacturing sector.<br />
18<br />
BBB is a reconstruction approach that seeks to reduce vulnerability and improve living conditions, while promoting more effective<br />
and sustainable reconstruction. It uses the opportunity of having to rebuild following a disaster event to examine the suitability and<br />
sustainability of reconstruction activities.<br />
Tropical Cyclone Winston, February 20, 2016<br />
23
2.<br />
Southern Taveuni, Vuna village<br />
Source: Vlad Sokhin/World Bank<br />
ECONOMIC AND SOCIAL<br />
IMPACTS<br />
24
FIJI Post-Disaster Needs Assessment<br />
2.1 Macroeconomic Impact<br />
2.1.1 Pre-Disaster Economic Outlook<br />
Gross Domestic Product<br />
The <strong>Fiji</strong>an economy grew at an average of 3.8 percent per annum from 2012 to 2014 on the back of higher government<br />
spending (particularly on infrastructure) and strong performances in the manufacturing, wholesale and retail, transport,<br />
tourism and financial sectors, among others. In October 2015, the Macroeconomic Committee estimated <strong>Fiji</strong>’s GDP growth<br />
at 4 percent in 2015 and 3.5 percent in 2016, driven by broad-based growth in most sectors. For 2017 and 2018, GDP<br />
growth was estimated at 3.1 percent (Figure 10).<br />
Before assessing the impact of TC Winston, the PDNA macroeconomic team had to reconsider the Macroeconomic<br />
Committee’s October 2015 forecasts in order to establish baseline estimates for 2015 to 2018, taking into account that the<br />
government’s revised 2015 and 2016 budget projections and data from key industries were not factored into the October<br />
2015 forecast. This was to ensure that the impact of TC Winston could be properly captured based on the latest data,<br />
particularly the potential impact of the disaster on tourist arrivals and agriculture production. This led to the adoption of<br />
baseline GDP growth projections of 4.2 percent and 3.8 percent for 2015 and 2016, respectively (Figure 10).<br />
GDP Growth (%)<br />
4.5<br />
4.0<br />
3.5<br />
3.0<br />
2.5<br />
2.0<br />
1.5<br />
4.0<br />
4.2<br />
3.5<br />
3.8<br />
3.1 3.2 3.1 3.1<br />
1.0<br />
0.5<br />
Figure 10: Pre-Disaster and Baseline GDP Forecast for 2015–2018<br />
Source: Estimations by Macro Assessment Team.<br />
Trade<br />
0.0<br />
<strong>Fiji</strong>’s exports have grown by an annual average rate of 14.2 percent from 2010–2014, while imports have grown by 12.9<br />
percent per annum over the same period. Export goods are comprised of such commodities as sugar, which is vulnerable<br />
to adverse weather conditions. Other major domestic exports include molasses, timber, fish, fruit and vegetables, coconut<br />
oil, gold, garments and mineral water. According to baseline projections, exports were anticipated to decline by 12.9<br />
percent in 2015 (due to decreased exports of sugar, fruits and vegetables, and lower re-exports of mineral fuels and fish)<br />
and grow by 17.5 percent in 2016.<br />
<strong>Fiji</strong> is a net importer, which means that it is susceptible to volatility in global commodity price fluctuations, which together<br />
accounted for about 45 percent of total imports, on average, from 2010 to 2014. Baseline projections expect imports to<br />
decline by 7.3 percent in 2015 due in part to lower expected mineral fuel imports. For 2016, imports were projected to<br />
grow by 7.8 percent.<br />
Balance of Payments<br />
2015 2016 2017 2018<br />
Pre-Disaster GDP<br />
Baseline GDP<br />
The Current Account deficit as a percent of GDP (at market price) indicated an overall increase from 2010 to 2014,<br />
growing from 4.7 percent to 7.2 percent of GDP. Import of goods, in particular mineral fuels, continued to be the underlying<br />
reason behind the Current Account deficit throughout the period, even though it was offset by the significantly improved<br />
performance in the services and secondary income account, of which tourism receipts from strong visitor arrivals and<br />
remittances are the main contributors. Tourism earnings and remittances have shown steady growth from 2010–2014,<br />
averaging around 18.1 percent and 4.5 percent of GDP, respectively. This trend is expected to continue.<br />
Tropical Cyclone Winston, February 20, 2016<br />
25
FIJI Post-Disaster Needs Assessment<br />
2.1.2 Post-Disaster Economic Outlook<br />
Gross Domestic Product<br />
The macroeconomic impact of TC Winston in 2016 is expected to be substantial given the massive extent of damage<br />
incurred, especially to key sectors, such as housing, transport, manufacturing, agriculture, electricity, communications and<br />
environment. The impact of the cyclone is estimated to reduce economic growth to 1.3 percent in 2016 compared to the<br />
pre-cyclone estimate of 3.8 percent (Figure 11). However, recovery and reconstruction activities during 2016 (if started<br />
opportunely) are estimated to boost GDP back up to 2.4 percent, a decrease of 1.4 percent compared to the pre-cyclone<br />
baseline estimate. This revised growth also reflects the expected impact of TC Zena, which passed southeast of <strong>Fiji</strong> only<br />
six weeks after TC Winston, causing torrential rain and major flooding. TC Zena’s impact is expected to be felt mainly in<br />
the agriculture sector.<br />
4.5<br />
4.2<br />
4.0<br />
3.8<br />
3.6<br />
GDP Growth (%)<br />
3.5<br />
3.0<br />
2.5<br />
2.0<br />
1.5<br />
2.4<br />
3.2<br />
2.6<br />
3.2<br />
3.1<br />
2.8<br />
1.0<br />
1.3<br />
0.5<br />
0.0<br />
2015 2016 2017 2018<br />
GDP Post TC Winston Baseline GDP Revised GDP with recovery & reconstruction<br />
Figure 11: Post-Disaster GDP Forecast 2015–2018<br />
Source: Estimations by Macro Assessment Team.<br />
In the agriculture sector, the cyclone’s impact on sugar cane production is expected to be substantial in 2016, given that<br />
it hit during the planting season. Production is expected to be around 1.4 million tonnes this year, compared to 1.8 million<br />
tonnes in 2015. Total losses for the agriculture sector as a whole are estimated at around F$171.1 million in 2016, with the<br />
worst impacts felt in the Cakaudrove, Bua, Naitasiri, Lomaiviti, Ra and Tailevu Provinces. Other cash crops also suffered<br />
major damage, such as coconuts, yaqona, taro, cassava, yams, vegetables and pawpaw.<br />
Lower sugar production is expected to impact on the manufacturing subsector, while other manufacturing and commerce<br />
activities were temporarily affected by disruptions to water and electricity supply.<br />
The social sectors suffered major damage and losses as well in terms of housing damage and disruptions to education<br />
services, as a number of schools in affected areas were utilized as evacuation centres. Infrastructure sectors (water,<br />
electricity, transport and communications) sustained minimal damage in comparison. Cross-Cutting Issues, such as<br />
culture, disaster risk management (DRM) and environment, suffered extensive damage; however, their impact on GDP is<br />
difficult to ascertain given that <strong>Fiji</strong> does not measure these sectors in its national accounts.<br />
Trade and Balance of Payments<br />
The impact of TC Winston on <strong>Fiji</strong>’s balance of payment position in 2016 will be quite substantial. Total exports are now<br />
projected to decline by 1.2 percent in 2016 compared to over 17 percent growth anticipated before the cyclone. This<br />
decline is driven primarily by expected decreases in sugar, dalo, coconut oil and yaqona exports. Yaqona plantations<br />
sustained damage to both young and matured plants and the impact will likely be realized in the medium term as the plant<br />
yields to maturity after about three years. In addition, coconut oil exports are expected to significantly decline in the short<br />
26 Tropical Cyclone Winston, February 20, 2016
FIJI Post-Disaster Needs Assessment<br />
to medium term. Imports will be higher than previously expected with an inflow of machinery, equipment and materials for<br />
reconstruction for the replacement of infrastructure in the housing, telecommunication and transport sectors. Food imports<br />
are also expected to increase due to the loss of locally grown produce. These impacts will raise the trade in goods deficit by<br />
18.5 percent this year, which, as a percent of GDP, is now estimated to increase from 27.3 percent to 32.4 percent in 2016.<br />
The cyclone had minimal impact on the tourism sector, which is expected to fully recover during 2016. Aid in-kind and cash<br />
grants have risen following the cyclone and reconstruction financing is expected to result in higher inflows during 2016<br />
and beyond. Overall, <strong>Fiji</strong>’s Current Account deficit for 2016 is estimated to increase by 8.9 percent driven by lower export<br />
earnings and higher import payments. This will raise the Current Account deficit to 12.9 percent of GDP (at market price)<br />
in 2016.<br />
Table 6: Balance of Payments: Trade in Goods (F$ million)<br />
2015 Baseline 2016 Baseline % change<br />
2016 Postcyclone<br />
% Change: 2015<br />
to 2016 Post-<br />
Cyclone<br />
Exports 2,004 2,356 17.5 1,980 -1.2<br />
Imports 4,645 5,006 7.8 5,110 10.0<br />
Balance on Trade<br />
in Goods<br />
Source: Estimations by Macro Assessment Team.<br />
-2,641 -2,651 0.4 -3,130 18.5<br />
Fiscal Impact<br />
Government expenditure on disaster relief and early recovery activities are being funded through reprioritization of line<br />
ministry budgets. Notable reallocations included top ups for social welfare programmes and food ration distribution. In<br />
addition, around F$70 million will be set aside for the upcoming Help for Homes residential rehabilitation and assistance<br />
programme, and the diversion of funds into relief, recovery and reconstruction will reduce funds available for the government’s<br />
existing development programmes. Large additional expenditures are expected to be required once the reconstruction and<br />
recovery programmes are fully specified.<br />
In terms of the disaster impact on revenue collections, based on expected production flow losses for 2016 estimated in this<br />
PDNA, value added tax (VAT) collections are expected to decline by about F$61.9 million this year. In addition, there will be<br />
reductions in the Service Turnover Tax as a result of losses in the tourism sector.<br />
2.2 Employment, Livelihoods and Social<br />
Protection<br />
2.2.1 Summary<br />
TC Winston affected approximately 540,400 people or 62 percent of the national population of <strong>Fiji</strong> (estimated as 865,611 at<br />
the end of 2014). 19 TC Winston has resulted in the loss of 14,450,129 work days and F$351.45 million in personal income.<br />
Table 7 presents the distribution of the affected population by division. The largest proportion of the affected population<br />
was in the Western Division followed by the Central, Northern and Eastern Divisions. An estimated 263,000 women may<br />
have been affected by the disaster. 20<br />
The affected populations comprise those who lost their lives, were injured or fell ill due to the cyclone (together accounted<br />
for about 0.03 percent); the displaced (those whose homes were totally destroyed accounted for about 10 percent); and<br />
those whose livelihoods were affected (accounted for some 89.75 percent) as a result of TC Winston. In terms of livelihoods<br />
affected, 57 percent relate to the agricultural sector, 17 percent to commerce, 10 percent to manufacturing, and 8 percent<br />
to tourism and transportation equally.<br />
19<br />
Population and Labour Force Estimates 2014.<br />
20<br />
Population and Labour Force Estimates 2014 reported that women comprise 48.8 percent of the population.<br />
Tropical Cyclone Winston, February 20, 2016<br />
27
FIJI Post-Disaster Needs Assessment<br />
Table 7: Population Affected by TC Winston<br />
Division Deaths Missing Hospitalised Injured<br />
Number<br />
of people<br />
affected due<br />
to loss of<br />
livelihood of<br />
main bread<br />
winner<br />
Number<br />
of people<br />
displaced<br />
Total number<br />
of people<br />
affected<br />
Central 6 2 24 162,698 5245 167,975<br />
Eastern 22 1 3 59 30,222 7595 37,902<br />
Northern 3 5 10 93,488 10210 103,716<br />
Western 13 17 24 198,622 32145 230,821<br />
Total 44 1 27 117 485,030 55,195 540,414<br />
Source: Estimates based on Government of <strong>Fiji</strong> data.<br />
Overall, the government’s social protection measures in response to TC Winston have translated into a financial contribution<br />
of F$$344.7 million. In terms of impact on the population, the disaster may result in increasing subsistence economic<br />
activity, widening income inequality, deepening poverty, introducing new challenges to the social protection measures in<br />
light of increasing demand for support, and reducing entrepreneurial confidence among the small and medium enterprises<br />
(SMEs) required for job creation and entrepreneurship.<br />
Recommendations for recovery highlight the need to strengthen the information base of informal workers and to: develop<br />
an informal economy policy; provide training in non-traditional skills for youth and women to support the expected labour<br />
demand in the construction sector; develop agricultural insurance for small farm holders to share the risk; establish<br />
emergency employment programmes designed to immediately improve livelihoods; create income generation targeting<br />
poor beneficiaries; and include people with disabilities.<br />
Southern Taveuni, Vuna Village<br />
Source: Vlad Sokhin/World Bank<br />
28
FIJI Post-Disaster Needs Assessment<br />
2.2.2 ESLP Sector Background<br />
Employment and Livelihoods<br />
<strong>Fiji</strong> faces a paradox of a low unemployment rate with high informal sector employment, high underemployment, and<br />
significant and pervasive engagement in subsistence activities.<br />
In 2010/2011, <strong>Fiji</strong>’s population aged 15 and over (working age population) totaled just below 600,000 (Figure 12).<br />
Approximately 64.4 percent of this population (or around 386,000) participated in the labour market (81.5 percent for<br />
men and 46.6 percent for women). Among labour force participants, 95.3 percent were employed while 4.7 percent were<br />
unemployed. Among the employed, almost 60 percent were in informal employment, defined as employed people not<br />
making contributions to the <strong>Fiji</strong> National Provident Fund (FNPF), leaving the majority of workers without income security for<br />
old age or to deal with shocks.<br />
Some 24 percent of the employed labour force is involved with subsistence work, which is concentrated in the agriculture<br />
sector. Only five percent of agricultural workers contribute to the FNPF. Self-employed people and students aged 15<br />
and over can voluntarily join the fund, but voluntary contributions remain limited (just one percent, or F$2.3 million out of<br />
F$375.7 million in 2014). 21 Almost 79 percent of rural workers are informally employed, compared with less than 40 percent<br />
of urban workers.<br />
The labour market also shows significant gender disparities, with men representing almost two-thirds of the labour force in<br />
2010/2011. While the proportion of males in informal employment accounted for 57 percent (2010/11), females accounted<br />
for about 65 percent of informal employment. A gender gap of 34.9 percent in labour force participation rates suggests<br />
significant opportunity to engage more women to meet the challenges of sustainable development.<br />
Unemployment rates for youth aged 15-24 in 2010/11 was 15 percent, almost four times higher than people aged 25-<br />
44 and almost 14 times higher than the 45-64 age group. Young women, in particular, have trouble finding jobs, with an<br />
unemployment rate of 19.5 percent compared with 12.9 percent for young men. A significant number of young women<br />
and men are also not receiving an education. In 2010/2011, the share of people aged 15-24 who were neither employed<br />
nor educated was 17.6 percent, down from 18.6 percent in 2004/2005. However, this share is three times higher for<br />
young women (27.5 percent) than young men (8.8 percent), primarily because women are responsible for more household<br />
duties. 22<br />
Three siblings stand on what was once a vegetable farm<br />
Source: Murray Lloyd/UN Women<br />
21<br />
FNPF 2014.<br />
22<br />
ILO/ADB <strong>Fiji</strong> Creating Quality Jobs: Employment Diagnostic Study 2015.<br />
Tropical Cyclone Winston, February 20, 2016<br />
29
FIJI Post-Disaster Needs Assessment<br />
The disability baseline study “Making Women with<br />
Disabilities Visible” (2010) found that 89 percent<br />
of people with disabilities were unemployed,<br />
53 percent of whom were men and boys, while<br />
women and girls comprised the remaining 47<br />
percent.<br />
Population aged 15<br />
and over<br />
599,402<br />
The 2015 ILO Rapid Assessment on Child<br />
Labour in <strong>Fiji</strong> found that out of 186 working<br />
children interviewed, 50 percent were working in<br />
hazardous conditions in agriculture, construction,<br />
scrap metal collection, fishing and diving, in<br />
garages, and in illicit activities and commercial<br />
sexual exploitation.<br />
In the Labour force<br />
386,390<br />
64.5%<br />
Not in the Labour force<br />
213,013<br />
35.5%<br />
Poverty<br />
Poverty is a multifaceted issue in <strong>Fiji</strong> and while it<br />
can be seen and classified in many developing<br />
countries as extreme, poverty in <strong>Fiji</strong> is generally<br />
viewed as a hardship and instances of extreme<br />
poverty are very rare. This means that hardships in<br />
<strong>Fiji</strong> are generally related to lack of access to a fully<br />
nutritional diet, clean drinking water, improved<br />
sanitation, quality education and health care, and<br />
employment or income earning opportunities. 23<br />
The country’s strong community-based<br />
agricultural and fishing traditions and traditional<br />
safety nets allow for an individual to be cared for<br />
within the community. This makes those living in<br />
poverty in <strong>Fiji</strong> far better off relative to those living in<br />
extreme poverty in some other countries.<br />
Employed<br />
386,118<br />
95.3%<br />
Money Income<br />
273,354<br />
76.0%<br />
Unemployed<br />
18,272<br />
4.7%<br />
No Money Income<br />
Subsistence<br />
86,569<br />
24.0%<br />
Figure 12: Labour Force Classification, 2010/2011<br />
Source: <strong>Fiji</strong> Creating Quality Jobs: Employment Diagnostics Study. ILO/ADB<br />
2015.<br />
2.5<br />
2.0<br />
Percent<br />
1.5<br />
1.0<br />
0.5<br />
0.0<br />
2002/03 2008/09 2013/14<br />
Rural 40 43 36.3<br />
Urban 28 17 20.8<br />
National 35 31 28.4<br />
Figure 13: Incidence of Poverty in Urban and Rural Areas<br />
Source: <strong>Fiji</strong> Bureau of Statistics. Household Income Expenditure Surveys 2002/2003, 2008/2009 and 2013/2014.<br />
The <strong>Fiji</strong> Bureau of Statistics (FBOS) has conducted three Household Income Expenditure Surveys (HIES) 24 over the years.<br />
Figure 13 shows that the overall incidence of poverty in <strong>Fiji</strong>an households decreased from 35 to 28.4 percent between the<br />
23<br />
Pacific Financial Inclusion Programme (009.<br />
24<br />
<strong>Fiji</strong> Bureau of Statistics. HIES 2002/2003, 2008/2009 and 2013/2014.<br />
25<br />
Percent of the population below the Basic Needs Poverty Line (BNPL) popularly referred to as the head count ratio.<br />
26<br />
Preliminary findings from the 2013/2014 survey presented by the government statistician.<br />
30 Tropical Cyclone Winston, February 20, 2016
FIJI Post-Disaster Needs Assessment<br />
2002/2003 and the 2013/2014 HIES, 25,26 whereas the incidence of poverty in urban areas declined from 28 to 18 percent<br />
between 2002/2003 and 2008/2009 before increasing slightly to 20.8 percent as reported by the 2013/2014 survey. 27 The<br />
growing population living in more than 200 informal settlements in major towns and cities is contributing to this increase.<br />
Additionally, rural poverty increased slightly between the 2002/2003 and the 2008/2009 surveys due to the decline in the<br />
sugar industry and reduced loans to agriculture. However, the 2013/2014 HIES indicated a decline in the incidence of rural<br />
poverty, taking it below the 2002/2003 level, which is a result of the broader spread of economic opportunities emanating<br />
from the various government programmes that have targeted rural communities through training programmes and job<br />
creation. 28<br />
Table 8: Incidence of Poverty (percent) by Division<br />
Household<br />
Income<br />
Expenditure<br />
Surveys<br />
2002/2003 2008/2009 2013/2014 Total Population<br />
Population<br />
Living below<br />
the Basic<br />
Needs Poverty<br />
Line during<br />
the Period<br />
2013/2014<br />
Urban Central 24 16 8.0 259,941 20,795<br />
Eastern 42 30 29.3 3,661 1,073<br />
Northern 39 38 34.8 33,205 11,555<br />
Western 33 17 22.1 133,944 29,602<br />
Rural Central 29 36 35.8 98,335 35,204<br />
Eastern 35 40 42.5 35,824 15,225<br />
Northern 57 51 52.1 101,116 52,681<br />
Western 38 43 26.5 179,239 47,498<br />
National 35 31 28.4 845,265 240,055<br />
Source: <strong>Fiji</strong> Bureau of Statistics. Household Income Expenditure Surveys 2002/2003, 2008/2009 and 2013/2014.<br />
In examining the incidence of poverty by division, the Northern Division continues to record the highest rate. 29 While the<br />
Western Division has the highest absolute number of rural people falling below the basic needs poverty line, the division has<br />
the lowest incidence of rural poverty (26.5 percent) as a proportion of the population. This level is half that of the rural north<br />
and almost ten percent less than the rural parts of the Central Division. The rural poverty rate fell sharply in the Western<br />
Division between 2009 (43 percent) and 2013/2014 (26.5 percent), which largely reflects the increase in employment<br />
associated with the tourism sector.<br />
Social Protection<br />
The government has put in place a range of social protection programmes to help those families struggling to meet their<br />
basic needs, including the: Poverty Benefit Scheme (PBS); Child Protection Allowance (CPA); Food Voucher Programme<br />
(FVP); Social Pension Scheme (SPS); the Bus Fare Subsidy; and the Expanded Food Voucher Programme for pregnant<br />
women in rural areas. These programmes are monitored by the Ministry of Women, Children and Poverty Alleviation, which<br />
ensures that assistance reaches the targeted groups.<br />
Since 2012, the government has allocated more than F$125 million to the four major social protection programmes, with<br />
a similar amount every year since then (Figure 14). While overall basic needs poverty levels have improved slightly, these<br />
figures show that the demand for social protection from vulnerable families has remained constant over time. It also shows<br />
the government’s commitment to provide social protection for the poor and vulnerable sectors of the population. Annex<br />
3: Supplementary Material for Employment, Livelihoods and Social Assessment provides a comprehensive overview of<br />
the various poverty alleviation programmes implemented by the government since 2009 and the corresponding budget<br />
allocations for each programme.<br />
27<br />
According to the National Housing Policy 2011, over 15 percent of the urban population resides in over 200 informal settlements<br />
(squatters) in <strong>Fiji</strong>’s major towns and cities. The Greater Suva area, including Nasinu, has the largest number of squatters.<br />
28<br />
Draft National Development Plan.<br />
29<br />
The BNPL has two components; the Food Poverty Line (FPL) and the Non-Food Poverty Line. The FPL consists of a basket of foods which<br />
for the 2002/2003 analysis was derived from the expenditure patterns derived from the middle quintile (20 percent) of the rural and urban<br />
groups of the major ethnic groups.<br />
Tropical Cyclone Winston, February 20, 2016<br />
31
FIJI Post-Disaster Needs Assessment<br />
As of March 2016, the total number of households receiving benefits under three major social protection programmes are<br />
as follows: 22,802 households under the PBS; 3,313 households under the CPA; and 17,782 households under the SPS.<br />
In 2015, the FVP for pregnant women in rural areas benefitted a total of 4,221 rural pregnant mothers from a F$1 million<br />
budget allocation.<br />
25,000,000<br />
20,000,000<br />
F$ million<br />
15,000,000<br />
10,000,000<br />
5,000,000<br />
0<br />
2012<br />
2013 2014 2015<br />
Social Pension Scheme<br />
Child Protection Allowance<br />
Poverty Benefit Scheme<br />
Food Voucher Programme<br />
Figure 14: Social Protection Budget (2012–2015)<br />
Source: <strong>Fiji</strong> Budget Esimates (2012–2015).<br />
Vulnerable Children<br />
Children comprise approximately one third of <strong>Fiji</strong>’s total population and are expected to remain at the same level by 2035. 30<br />
According to the HIES 2008/2009, 61 percent of children belonged to families living below the basic needs poverty line and<br />
almost 80 percent of children were in families that lacked sufficient income to invest in their development. Children in specific<br />
areas of the country were identified as being particularly disadvantaged, including those living in squatter settlements, low<br />
quality urban housing, rural areas and the Northern Division. 31<br />
Elderly<br />
In response to the National Ageing Policy, 32 the SPS was introduced for elderly people with an annual household income<br />
of F$9,100 or less. While the FNPF provides cover in old age for those in the formal sector, SPS will cater to the estimated<br />
70 percent of the elderly population who are not covered by FNPF. In 2015, the SPS eligibility age was reduced from 70<br />
to 68 and the allowance was increased from F$30 to F$50 per month to assist more senior citizens. This is reflected in<br />
the upward trend in the cost of the SPS from F$3 million in 2014 to F$8 million in 2015. The eligibility age will be further<br />
reduced to 66 effective from July 2016.<br />
People Living with Disabilities<br />
According to the Pacific Disability Forum, 4,534 people with disabilities live in cyclone-affected areas. The <strong>Fiji</strong> Disabled<br />
Peoples Federation undertook an assessment of 986 people with disabilities and found that tools they used for their<br />
livelihoods and micro businesses had been destroyed, particularly in the red zones, and women’s weaving produce was<br />
destroyed, including pandanus leaves.<br />
2.2.3 Assessment of Disaster Impact<br />
Employment and Livelihoods<br />
TC Winston affected approximately 540,400 people and the livelihoods of about 108,083 households located across the<br />
country’s four divisions. While 5,780 laid-off employees and/or workers with interrupted income-generating activities were<br />
reported as of April 2016, a decline in production of goods and services are estimated over a five-year period, likely to result<br />
30<br />
2007 National Population Census.<br />
31<br />
Republic of <strong>Fiji</strong> Poverty Trends, Profiles and Small Area Estimation (Poverty Maps) in Republic of <strong>Fiji</strong> (2003-2009), World Bank 2011.<br />
32<br />
Recent progress in the government’s commitment to addressing ageing includes passing the National Council of Older Persons (NCOP)<br />
Decree 2012. This enabled the establishment of the NCOP for the purpose of inclusivity, instilling dignity, respect for human rights and<br />
meeting basic needs through the empowerment of older people and for related matters (NCOP Decree, 2012). The NCOP is directly<br />
aligned to the National Ageing Policy [2011-2015], which the Cabinet endorsed in 2011.<br />
32 Tropical Cyclone Winston, February 20, 2016
FIJI Post-Disaster Needs Assessment<br />
in a loss of 14,450,129 work days and F$351.45 million in personal income (Table 9). 33 The largest number of workdays<br />
and income loss occurred in the Northern Division followed by the Western, Central and Eastern Divisions, which follows<br />
the pattern of the extent of damage and loss in the productive sectors.<br />
Table 9: Work Days and Personal Income Lost by Division<br />
Division Work Days Lost Personal Income Lost (F$ million)<br />
Central 2,660,634 63.9<br />
Eastern 1,338,970 33.8<br />
Northern 6,093,521 148.3<br />
Western 4,357,004 105.4<br />
Total 14,450,129 351.4<br />
Source: ILO estimates based on Government of <strong>Fiji</strong> data.<br />
Several data extrapolation methods have been used to construct the baseline and to derive an estimate of the cyclone<br />
impact on Employment, Livelihoods and Social Protection (ESLP), including primary and secondary sources. 34 As the<br />
ESLP assessment is based on cross-sectoral analysis, additional data were obtained from the agriculture sector (loss<br />
of agricultural output), tourism sector (estimated duration of business interruption), manufacturing and commerce sector<br />
(number of recorded layoffs) to conduct a quantitative analysis of the cyclone’s effect on ELSP. Results were subsequently<br />
triangulated and complemented through qualitative observations in affected communities, and through interviews with<br />
representatives of the FNPF, <strong>Fiji</strong> Commerce & Employers Federation, <strong>Fiji</strong> Trades Union Congress, <strong>Fiji</strong> Sugar Cane Growers<br />
Council, <strong>Fiji</strong> Disabled Peoples Federation, <strong>Fiji</strong> National Youth Council, Women Entrepreneurs Business Council and <strong>Fiji</strong><br />
Taxi Union, to name a few. An additional rapid survey was conducted by the Integrated Human Resources Development<br />
Program, a division of the Strategic Planning Office (SPO), to gather data on the effects of TC Winston on informal microenterprises.<br />
A key finding of the assessment noted a high risk of loss in business confidence, particularly by young micro<br />
entrepreneurs. The effects of the disaster on civil servants and public employees, such as teachers, has not been taken<br />
into account, as wages continue to be paid. 35<br />
Table 10 presents the number of work days lost and income loss by sector, with a large proportion of personal income<br />
loss in the agriculture sector (F$298.16 million), which has a significant proportion of workers or 44.2 percent of the<br />
economically active population. 36<br />
Table 10: Work Days and Personal Income Lost by Productive Sectors and Transport Sector<br />
Division Work Days Lost Personal Income Lost (F$ million)<br />
Agriculture 12,851,608 298.2<br />
Commerce 498,149 17.1<br />
Manufacturing 585,873 18.5<br />
Tourism 495,021 17.0<br />
Transport a 19,478 0.7<br />
Total 14,450,129 351.5<br />
Source: ILO estimates based on Government of <strong>Fiji</strong> data.<br />
Social Protection Post-TC Winston<br />
In response to TC Winston, the government has been using existing social welfare schemes to efficiently disburse cash to<br />
vulnerable groups and inject much needed cash into the economy. On March 18, 2016, a total of F$19.9 million (US$9.4<br />
million) was disbursed under three social protection programmes. Under the PBS, 22,802 households were paid a lump<br />
sum of F$600, or the equivalent of F$200 for three months. 17,782 pensioners of the SPS over the age of 68 received an<br />
33<br />
The PDNA Guidelines note that as GDP losses are usually expressed in terms of annual GDP, this estimate refers to the amount of work<br />
(e.g., workdays) or work income lost in the year of the disaster and following years, and does not distinguish between jobs completely lost,<br />
jobs temporarily suspended or jobs with reduced income. Part of this loss might be offset in case of a speedy recovery of the productive<br />
sectors.<br />
34<br />
Secondary sources included the Population and Labour Force Survey 2014, the 2007 Census of Agriculture, the 2009 National Population<br />
and Housing Census, the 2009-2012 Decent Work Country Programme, and the 2013-14 HIES Preliminary Findings – Release 1.<br />
35<br />
Civil servants and other public employees have been stretched to capacity in trying to fulfil the demands caused by TC Winston.<br />
36<br />
ILO, ADB. <strong>Fiji</strong> Creating Quality Jobs: Employment Diagnostic Study.<br />
Tropical Cyclone Winston, February 20, 2016<br />
33
FIJI Post-Disaster Needs Assessment<br />
additional F$300 (F$100 over three months). Finally, 3,313 families under the Care and Protection Scheme (CPS) received<br />
a total of F$300. The cash top-up payments were intended to help people meet immediate expenses following TC Winston<br />
and were provided to all existing beneficiaries, irrespective of whether they resided in affected areas.<br />
On April 8, 2016, the government announced the approval of a FVP top-up of F$4.6 million to beneficiaries under the PBS,<br />
SPS and CPS who reside in the 12 priority regions only. The top-up will be provided for May and June 2016, assisting<br />
approximately 44,169 households. The programme will be implemented with the help of the World Food Programme.<br />
The government has also announced the roll-out of the Help for Homes initiative, a housing programme where the<br />
government will provide affected households with vouchers (electronic cards) for housing rehabilitation and reconstruction.<br />
The programme is targeted to households with an annual income under F$50,000 (US$24,000) who experienced housing<br />
damage.<br />
The FNPF has allowed its members to make withdrawals post-TC Winston, resulting in a significant injection of cash into<br />
the economy. Active members were allowed to withdraw up to F$1,000, plus an additional F$5,000 when they could<br />
present proof (property title) of having a house in the TC-affected area. In total, the FNPF has processed and approved<br />
170,000 withdrawal applications, including 35,000 in the second (F$5,000) category. These one-time withdrawals resulted<br />
in a massive injection of around F$250.2 million cash into the economy.<br />
Overall, the government’s disaster responsive social protection measures post-TC Winston have translated into a financial<br />
contribution of F$344.7 million as seen in Table 11. However, this money has been diverted from existing programmes, so<br />
there may be implications for regular development initiatives.<br />
Table 11: Major Social Protection Interventions and Cash Flow Post-TC Winston<br />
Programme<br />
Number of Beneficiaries<br />
(Households)<br />
Duration<br />
Budget (F$ million)<br />
Social Welfare Top-up Payments 43,897 3 months (March-May 2016 19.9<br />
Food Voucher Program 44,169 2 months (May-June 2016) 4.6<br />
Housing Programme April 2016 - onwards 70<br />
<strong>Fiji</strong> National Provident Fund (FNPF) 170,000 2 months (March-April 2016) 250.2<br />
Total 344.7<br />
Source: Assessment Team based on Government of <strong>Fiji</strong> data.<br />
Disaster Impact on Employment, Livelihoods and Social Protection<br />
TC Winston is expected to have a significant impact on the livelihoods and social conditions of the population of <strong>Fiji</strong>. 37<br />
With an expected recovery period in the productive sector ranging from three months to ten years, much of the population<br />
engaged in economic activity may be forced to increase its share of subsistence work as part of its economic activity.<br />
Before TC Winston, about one-half of workers were reportedly only doing paid work, while about one-quarter had both<br />
paid and subsistence work and one quarter had subsistence work only. 38 Women may fare worse than men as their<br />
observed increase in the labour force in the 2010-2011 period was primarily in informal work and subsistence activities. 39<br />
TC Winston may cause a crowding into the informal sector, thus squeezing women out as more men seek to increase their<br />
share of informal activity and subsistence work.<br />
The issue of rising income inequality requires attention. The Employment Diagnostic Study, undertaken by the ILO and the<br />
ADB using FBOS data, suggested a strong increase in household income inequality between 2004/2005 and 2010/2011. 40<br />
The study further notes that, among other things, the increase in income inequality may reflect the concentration of<br />
subsistence employment in agricultural and rural areas. Most civil servants and salaried people will not suffer income<br />
loss as a result of TC Winston; however some segments of the population will experience income loss and a further<br />
concentration in subsistence employment may occur. If inadequate scaling-up of social protection measures persist, the<br />
result may be increasing income inequality.<br />
The possibility of people sinking into deepening poverty or more of the population becoming poor following TC Winston<br />
is likely. The 2013-2014 HIES reported a national incidence of poverty of 28.1 percent in 2013-2014, a decrease of 2.9<br />
percent from the 2008-2009 period. This poverty rate suggests that total earnings of some 240,055 people were below<br />
37<br />
Sector assessments provide detailed accounts of the extent of damage and change in economic flows which have occurred in each sector<br />
and the length of recovery period required to return to normalcy.<br />
38<br />
ILO/ADB. <strong>Fiji</strong> Creating Quality Jobs: Employment Diagnostic Study. 2015. Pg.31<br />
39<br />
Ibid. pg. 8.<br />
40<br />
Ibid. pg. 39.<br />
34 Tropical Cyclone Winston, February 20, 2016
FIJI Post-Disaster Needs Assessment<br />
the poverty line (F$55.12 and F$49.50 per adult equivalent per week for urban and rural respectively). Data suggests that<br />
some 90 percent (485,030) of the affected population has suffered and may continue to suffer income loss, falling below<br />
the poverty line, into the emerging poor group. Currently, the government’s Social Protection Programme supports a little<br />
over 200,000 beneficiaries. Despite measures, such as the housing grant, which was provided to some 35,000 people<br />
in the amount of F$5,000, and withdrawals granted to 135,000 people, both from the FNPF, the government may still be<br />
confronted with an additional 33 percent of the population seeking assistance, in addition to its normal beneficiaries.<br />
Despite the injection to the economy of some F$250 million and assurances given that the FNPF is strong (with a reserve<br />
of some F$5 billion), the withdrawal of money may have a long-term impact on the Fund’s viability and a reduction in the<br />
volume of pensions, which participants may receive in the future.<br />
Micro, small and medium enterprises may be at risk of losing momentum and entrepreneurial confidence due to the extent<br />
of damage and change in economic flows suffered as a result of TC Winston. This will impact the ability of the local private<br />
sector to lead much-needed employment creation and local economic growth in the affected areas and informal sectors.<br />
2.2.4 Recovery Strategy and Needs<br />
In addition to the immediate measures undertaken since TC Winston, such as the implementation of a Community Based<br />
Emergency Employment programme, 41 which includes cash for work, farming tools, health and safety training, social<br />
security link to FNPF, child labour awareness, link to overseas seasonal work and other social programmes, more must be<br />
done. Recovery needs are estimated at F$31.5 million, as set out in Table 12. The following are a brief outline of policies,<br />
which seek to address the medium- and long-term impacts of TC Winston.<br />
Employment and Livelihoods<br />
A task force may be established to review, develop and implement a comprehensive and innovative response programme<br />
for the medium and long term to support disenfranchised informal and subsistence workers in rural areas. This should result<br />
in the development of an informal economy policy based on a robust database in order to inform targeted interventions to<br />
empower the informal economy and lead to increased formalization of micro and small enterprises. Such a process should<br />
be facilitated through simpler registration procedures, coupled with formalization incentives (e.g., eligibility for subsidies<br />
and credit).<br />
The register of people seeking employment should facilitate a ready-to-work pool, available for deployment for employment<br />
intensive infrastructure programmes as significant volumes of employment can be created during the reconstruction of<br />
public and community infrastructure. Women and youth must be trained in non-traditional skills for ready absorption into<br />
the construction sector during this phase and people with disabilities should be included as well.<br />
The development of agricultural insurance may be considered to reduce the risk of shocks experienced by disaster. In order<br />
to meet the major institutional and technical/operational challenges, such a package will require collaboration between the<br />
government, the Insurance Council of <strong>Fiji</strong>, farmer cooperatives, the microfinance and banking sectors, and development<br />
partners.<br />
The development of an enterprise recovery programme with a robust public-private partnership should ensure that<br />
enterprises restart and consequently regenerate employment.<br />
Social Protection<br />
An analysis of the proportion of households in the PBS that was previously just above the poverty cut-off score, but as a<br />
result of TC Winston has drifted below, should be undertaken. The Department of Social Welfare has begun a process of<br />
consolidating and centralizing the PBS Registry, which will be useful for this purpose, and estimates a recovery budget of<br />
F$7 million for the recovery period for the expansion of current social protection programmes.<br />
The impact of the top-up transfers delivered through the three core social assistance programmes in response to TC<br />
Winston should be assessed, which will help inform future post-disaster cash transfer initiatives.<br />
The emergency employment programmes or skills development trainings designed for immediate livelihood and income<br />
generation should be targeted towards the pro-poor beneficiaries who are part of the PBS (10,931 households in the 12<br />
severely affected areas), ensuring inclusiveness in terms of gender and people living with disabilities (PLWD).<br />
A review of existing social protection measures and the development of policies for use in future disasters, as the basis for<br />
the development and approval of informed social protection legislation, should be undertaken.<br />
41<br />
This pilot programme is implemented by the Ministry of Employment, Productivity and Industrial Relations and supported by the National<br />
Disaster Management Office (NDMO) and the MOA through the Food Security and Livelihoods Cluster<br />
Tropical Cyclone Winston, February 20, 2016<br />
35
FIJI Post-Disaster Needs Assessment<br />
Table 12: Total Recovery and Reconstruction Needs for the ESLP Sector (F$ million)<br />
Recovery Reconstruction Resilience Total<br />
Micro-enterprise support and preparedness 7 7<br />
Enterprise Recovery Programme (to support<br />
enterprises in the formal sector)<br />
10 10<br />
Expansion of existing social benefit scheme 7 7<br />
Capacity building of Government agencies and CSO’s<br />
that support micro enterprises<br />
Skills Development & Business Confidence<br />
Programme for construction sector using<br />
Employment Intensive Infrastructure Programmes<br />
(EIIP)<br />
Child Labour monitoring, advocacy and withdrawal<br />
programme<br />
Study on the <strong>Fiji</strong> National Provident Fund (FNPF) on<br />
the impact of withdrawals for disasters and social<br />
security support programmes for informal workers<br />
3.5 3.5<br />
3 3<br />
0.5 0.5<br />
0.5 0.5<br />
Total 31.5 31.5<br />
Source: Estimations by Assessment Team.<br />
Note: A detailed breakdown of recovery needs by sector is included in Annex 2.<br />
2.3 Disaster Impact on Quality of Life<br />
While the overall economic impact of disasters varies widely, it is always significantly negative on the quality of life of the<br />
affected population, particularly in the case of more vulnerable population groups.<br />
Reliable quantitative procedures exist to estimate disaster impact at the macroeconomic level, but methodologies to<br />
quantitatively estimate disaster impact at the personal or household level have lagged behind, often concentrating only<br />
on qualitative means of assessment. The Human Development Index (HDI) was used as a proxy quality of life indicator;<br />
however, the HDI is relatively static and does not lend itself to measuring impact on quality of life caused by a sudden<br />
disaster, and is not available in all countries nor at sub-national levels.<br />
To estimate the changes in quality of life following TC Winston, a composite measurement index was estimated based on<br />
relatively simple indicators, and data was collected during the relatively short duration of this PDNA. 42 This approach was<br />
successfully applied and tested during the recent PDNAs following the 2015 Nepal earthquake and Myanmar floods and<br />
landslides. 43<br />
The following sectoral indicators are used in estimating disaster impact on quality of life for the affected population:<br />
<br />
<br />
<br />
<br />
<br />
<br />
<br />
<br />
disease outbreaks arising from the disaster;<br />
<br />
<br />
<br />
<br />
In addition to the above, whenever agricultural production losses were high in comparison to normal productions volumes,<br />
which may occur as a result of slow-evolving disasters, an additional indicator measuring food insecurity may be added.<br />
42<br />
Jovel, Roberto. Estimation of Disaster-Induced Losses to Define Post-Disaster Recovery Requirements, in Disaster Recovery: The<br />
Governance, Economics, and Social Impacts, Asian Disaster Management News, Volume 22, Asian Disaster Preparedness Center (ADPC),<br />
Bangkok, Thailand, 2015.<br />
43<br />
See Myanmar Post-Disaster Needs Assessment on Floods and Landslides, July–September 2015, Government of the Union of Myanmar,<br />
November 2015.<br />
36 Tropical Cyclone Winston, February 20, 2016
FIJI Post-Disaster Needs Assessment<br />
Based on the values obtained for pre-disaster and post-disaster conditions for the above-listed sector indicators, and<br />
assigning equal weights to each, a composite indicator is developed that provides a measure of how the affected<br />
population’s quality of life deteriorated because of the disaster. Moreover, the estimated quality of life composite indicator<br />
may be used in the future as a measure of the degree of recovery being achieved over time.<br />
2.3.1 Quantification of Sectoral Quality of Life Indicators<br />
During the 2016 <strong>Fiji</strong> PDNA, existing sectoral baseline information and the estimated value of the main disaster effects were<br />
used to define quality of life.<br />
Housing<br />
While information on pre-disaster housing deficits was not fully available, data was collected on the number of households<br />
existing in all disaster-affected provinces from the 2007 census and the most recent household survey.<br />
In addition, the number of fully destroyed housing units, together with those that sustained high partial destruction caused<br />
by the cyclone, was obtained from local and national authorities (Table 13). Housing units that sustained only minor damage<br />
were not considered for the analysis.<br />
Table 13: Pre- and Post-Disaster Housing Data in Disaster-Affected Provinces<br />
Province<br />
Pre-Disaster number of<br />
Housing Units<br />
Post-Disaster number of Houses<br />
Destroyed<br />
Major Damage<br />
Ba 47,533 3,494 4,241<br />
Bua 2,794 524 605<br />
Cakaudrove 7,858 1,513 2,199<br />
Kadavu 2,161 0 0<br />
Lau 5,897 328 63<br />
Lomaiviti 2,517 1,191 296<br />
Macuata 5,636 5 10<br />
Nadroga 9,250 122 259<br />
Naitasiri 25,240 542 365<br />
Namosi 1,419 27 14<br />
Ra 5,946 2,813 757<br />
Rewa 16,426 66 78<br />
Rotuma 639 0 0<br />
Serua 2,596 19 19<br />
Tailevu 10,378 395 287<br />
Source: Estimations by Assessment Team.<br />
The housing index was estimated for pre-disaster and post-disaster situations (Table 14).<br />
Table 14: Pre- and Post-Disaster Housing Index by Province<br />
Province Pre-Disaster Post-Disaster<br />
Ba 1.0135 0.8485<br />
Bua 0.9164 0.5461<br />
Cakaudrove 0.8162 0.4307<br />
Kadavu 0.9586 0.9586<br />
Lau 0.4823 0.4504<br />
Lomaiviti 0.9224 0.3780<br />
Macuata 1.0785 1.0756<br />
Tropical Cyclone Winston, February 20, 2016<br />
37
FIJI Post-Disaster Needs Assessment<br />
Province Pre-Disaster Post-Disaster<br />
Nadroga 0.8595 0.8242<br />
Naitasiri 0.8688 0.8375<br />
Namosi 1.0423 1.0122<br />
Ra 0.9228 0.3688<br />
Rewa 0.7873 0.7804<br />
Rotuma 0.6750 0.6750<br />
Serua 0.6851 0.6751<br />
Tailevu 0.9539 0.8913<br />
Source: Estimations by Assessment Team.<br />
Education<br />
Baseline information on the number of schools that existed and of students enrolled before the disaster was obtained. Data<br />
on the number of disaster-affected schools – whether totally or significantly damaged – and the corresponding number of<br />
students that had to be relocated to other schools or other premises were also ascertained. Table 15 shows the baseline<br />
information and the estimated values of the pre- and post-disaster education index.<br />
Table 15: Pre- and Post-Disaster Education Index by Province<br />
Province Pre-Disaster Post-Disaster<br />
Number of Students<br />
Enrolled<br />
Education Index<br />
Number of Students<br />
Affected<br />
Education Index<br />
Ba 57,056 1.0000 34,460 0.3960<br />
Bua 4,018 1.0000 1,177 0.7071<br />
Cakaudrove 15,597 1.0000 8,410 0.4608<br />
Kadavu 3,004 1.0000 126 0.9581<br />
Lau 2,682 1.0000 591 0.7796<br />
Lomaiviti 5,565 1.0000 4,359 0.2167<br />
Macuata 17,894 1.0000 1,400 0.9218<br />
Nadroga 14,343 1.0000 3,332 0.7677<br />
Naitasiri 31,429 1.0000 3,746 0.8808<br />
Namosi 1,653 1.0000 1,143 0.3085<br />
Ra 8,431 1.0000 7,975 0.0541<br />
Rewa 35,137 1.0000 11,937 0.6603<br />
Rotuma 521 1.0000 1.0000<br />
Serua 5,211 1.0000 2,133 0.5907<br />
Tailevu 16,831 1.0000 5,547 0.6704<br />
Source: Estimations by Assessment Team.<br />
Health<br />
Data on pre-disaster morbidity levels in disaster-induced disease for the months of February and March of 2015 and 2016<br />
were obtained and analyzed. Only the number of patients with digestive disease conditions increased following the disaster<br />
due to the consumption of unsafe drinking water. On that basis, the health index was estimated for pre- and post-disaster<br />
conditions (Table 16).<br />
38 Tropical Cyclone Winston, February 20, 2016
FIJI Post-Disaster Needs Assessment<br />
Table 16: Pre- and Post-Disaster Health Index by Province<br />
Province Population Pre-Disaster Post-Disaster<br />
Number of Cases Health Index Number of Cases Health Index<br />
Ba 244,366 298 0.9988 623 0.9975<br />
Bua 15,148 164 0.9892 234 0.9846<br />
Cakaudrove 52,480 320 0.9939 700 0.9867<br />
Kadavu 10,854 93 0.9914 94 0.9913<br />
Lau 11,455 1.0000 1.0000<br />
Lomaiviti 17,296 79 0.9954 18 0.9990<br />
Macuata 76,648 875 0.9886 168 0.9978<br />
Nadroga 61,799 236 0.9962 15 0.9998<br />
Naitasiri 168,711 80 0.9995 114 0.9993<br />
Namosi 7,300 1.0000 1.0000<br />
Ra 31,329 75 0.9976 1.0000<br />
Rewa 106,329 524 0.9951 538 0.9949<br />
Rotuma 19,282 1.0000 238 0.9877<br />
Serua 58,957 1.0000 1.0000<br />
Tailevu 2,166 278 0.8716 44 0.9797<br />
Source: Estimations by Assessment Team.<br />
Water Supply<br />
The most recent information on household access to safe water service was used to define the baseline for the analysis.<br />
Such data was combined with information on the number of affected households that due to the disaster caused by TC<br />
Winston no longer had direct access to a safe water supply. Table 17 shows the values of the safe water access index for<br />
pre-disaster and post-disaster conditions.<br />
Table 17: Pre- and Post-Disaster Water Supply Access Index by Province<br />
Province Pre-Disaster Post-Disaster<br />
Number of<br />
Households<br />
Number of<br />
Households<br />
with Access<br />
Water Access<br />
Index<br />
Number of<br />
Houses<br />
Disconnected<br />
Number of<br />
Households<br />
with Access<br />
Water Access<br />
Index<br />
Ba 52,570 48,047 0.9140 7,735 40,312 0.7668<br />
Bua 3,205 2,654 0.8281 1,129 1,525 0.4758<br />
Cakaudrove 10,708 9,422 0.8799 3,712 5,710 0.5332<br />
Kadavu 2,387 2,148 0.8999 2,148 0.8999<br />
Lau 2,440 2,329 0.9545 391 1,939 0.7945<br />
Lomaiviti 3,568 3,285 0.9207 1,487 1,799 0.5041<br />
Macuata 16,411 13,155 0.8016 15 13,140 0.8007<br />
Nadroga 12,871 8,360 0.6495 381 7,980 0.6200<br />
Naitasiri 33,551 32,435 0.9667 907 31,529 0.9397<br />
Namosi 1,423 1,411 0.9916 41 1,370 0.9628<br />
Ra 6,821 5,353 0.7848 3,570 1,784 0.2615<br />
Rewa 22,157 22,019 0.9938 144 21,876 0.9873<br />
Rotuma 484 484 1.0000 484 1.0000<br />
Serua 3,970 3,935 0.9912 38 3,897 0.9816<br />
Tailevu 11,619 11,091 0.9546 682 10,410 0.8959<br />
Source: Estimations by Assessment Team.<br />
Tropical Cyclone Winston, February 20, 2016<br />
39
FIJI Post-Disaster Needs Assessment<br />
Sanitation<br />
Similar information was collected regarding the number of households that had access to safe sanitation facilities before<br />
the disaster and those that lost such access to sanitation as a result of TC Winston.<br />
Sanitation service coverage in the country is much lower than access to safe water supply, which explains the very low<br />
values of pre- and post-disaster sanitation access indexes (Table 18).<br />
Table 18: Pre- and Post-Disaster Sanitation Access Index by Province<br />
Province Pre-Disaster Post-Disaster<br />
Number of<br />
Households<br />
Number of<br />
Households<br />
with Access<br />
Sanitation<br />
Index<br />
Number of<br />
Houses<br />
Affected<br />
Number of<br />
Households<br />
with Access<br />
Sanitation<br />
Index<br />
Ba 52,570 7,542 0.1435 7,735 0 0.0000<br />
Bua 3,205 1,084 0.3382 1,129 45 0.0140<br />
Cakaudrove 10,708 1,420 0.1326 3,712 2,292 0.2140<br />
Kadavu 2,387 227 0.0951 227 0.0951<br />
Lau 2,440 198 0.0811 391 0.0000<br />
Lomaiviti 3,568 119 0.0334 1,487 0.0000<br />
Macuata 16,411 4,306 0.2624 15 4,291 0.2615<br />
Nadroga 12,871 3,568 0.2772 381 3,188 0.2476<br />
Naitasiri 33,551 1,966 0.0586 907 1,060 0.0316<br />
Namosi 1,423 145 0.1019 41 104 0.0731<br />
Ra 6,821 2,097 0.3074 3,570 1,473 0.2159<br />
Rewa 22,157 1,082 0.0488 144 939 0.0424<br />
Rotuma 484 2 0.0041 2 0.0041<br />
Serua 3,970 336 0.0846 38 298 0.0751<br />
Tailevu 11,619 1,586 0.1365 682 905 0.0778<br />
Source: Estimations by Assessment Team.<br />
Electricity<br />
For access to electricity, baseline information on the number of residential connections to the <strong>Fiji</strong> Electricity Authority (FEA)<br />
grid was obtained from the utility. An additional number of households obtain electricity from isolated systems but no<br />
information on their number was made available at the time of the PDNA. Thus, the analysis only covered data on electricity<br />
access from the FEA.<br />
Table 19 shows the estimated electricity access index for each province. If data on connections to isolated electrical<br />
systems had been included, some of the values of the access index – in Bua, Kadavu, Lau and Rotuma Provinces – would<br />
not be 0.<br />
Table 19: Pre- and Post-Disaster Access to Electricity Index by Province<br />
Province Pre-Disaster Post-Disaster<br />
Number of<br />
Households<br />
Number of<br />
Households<br />
Connected to<br />
Grid<br />
Electricity<br />
Index<br />
Number of<br />
of Houses<br />
Disconnected<br />
Number of<br />
Households<br />
Connected<br />
to Grid<br />
Electricity<br />
Index<br />
Ba 52,570 42,487 0.8082 7,735 34,752 0.6611<br />
Bua 3,205 0.0000 0.0000<br />
Cakaudrove 10,708 3,084 0.2880 3,712 0.0000<br />
Kadavu 2,387 0.0000 0.0000<br />
Lau 2,440 0.0000 0.0000<br />
Lomaiviti 3,568 2,027 0.5681 1,487 541 0.1515<br />
Macuata 16,411 13,328 0.8121 15 13,313 0.8112<br />
40 Tropical Cyclone Winston, February 20, 2016
FIJI Post-Disaster Needs Assessment<br />
Province Pre-Disaster Post-Disaster<br />
Number of<br />
Households<br />
Number of<br />
Households<br />
Connected to<br />
Grid<br />
Electricity<br />
Index<br />
Number of<br />
of Houses<br />
Disconnected<br />
Number of<br />
Households<br />
Connected<br />
to Grid<br />
Electricity<br />
Index<br />
Nadroga 12,871 8,035 0.6243 381 7,655 0.5947<br />
Naitasiri 33,551 32,525 0.9694 907 31,619 0.9424<br />
Namosi 1,423 580 0.4076 41 539 0.3788<br />
Ra 6,821 3,983 0.5839 3,570 414 0.0606<br />
Rewa 22,157 28,091 1.2678 144 27,948 1.2613<br />
Serua 3,970 3,961 0.9977 0.9977<br />
Tailevu 11,619 15,847 1.3639 38 15,809 1.3606<br />
Rotuma 484 0.0000 0.0000<br />
Source: Estimations by Assessment Team.<br />
Personal Income Decline<br />
In 2008, the FBOS conducted a household survey of income and expenditure, which provided a baseline for income by<br />
division. 44 Such information was combined with data on population per province and nominal GDP, in order to obtain a<br />
measure of GDP per province. In addition, non-disaster and post-disaster GDP forecasts for 2016 were used in combination<br />
with the estimated value of production losses in each province in order to determine the decline in per capita GDP arising<br />
from the disaster’s impact.<br />
Per capita GDP by province data were used to estimate a personal income index under pre- and post-disaster conditions<br />
(Table 20). The estimated highest decline in personal income in 2016 will likely occur in Bua Province (just above 20<br />
percent); the second highest decline will occur in Lomaiviti, Cakaudrove and Ra Provinces (around 9 percent); and residents<br />
of Tailevu and Lau Provinces are expected to sustain an estimated 4 percent decline in personal income. Personal income<br />
decline will likely go beyond the current year, and last at least two more years in view of the disaster’s impact.<br />
Table 20: Pre- and Post-Disaster Personal Income Index by Province<br />
Province Population Personal Income Index 2016 GDP (F$ million) 2016 Per Capita GDP (F$)<br />
Non-Disaster Post-Disaster Non-Disaster Post-Disaster Non-Disaster Post-Disaster<br />
Ba 244,366 0.9244 0.9046 2,679.3 2,621.8 10,964.3 10,729.1<br />
Bua 15,148 1.0000 0.7882 179.7 141.6 11,860.4 9,348.8<br />
Cakaudrove 52,480 0.9102 0.8247 566.6 513.3 10,795.7 9,781.5<br />
Kadavu 10,854 0.9463 0.9463 121.8 121.8 11,223.3 11,223.3<br />
Lau 11,455 0.8774 0.8377 119.2 113.8 10,406.4 9,935.2<br />
Lomaiviti 17,296 0.9048 0.8151 185.6 167.2 10,731.9 9,667.6<br />
Macuata 76,648 0.8145 0.8021 740.5 729.1 9,660.8 9,512.7<br />
Nadroga 61,799 0.8924 0.8822 654.1 646.6 10,584.6 10,463.7<br />
Naitasiri 168,711 0.9738 0.9679 1,948.6 1,936.8 11,549.8 11,479.7<br />
Namosi 7,300 0.9776 0.9734 84.6 84.3 11,595.1 11,544.7<br />
Ra 31,329 0.9220 0.8282 342.6 307.7 10,934.9 9,823.0<br />
Rewa 106,329 0.9186 0.9178 1,158.5 1,157.5 10,895.4 10,885.8<br />
Rotuma 2,166 0.7923 0.7923 20.4 20.4 9,396.7 9,396.7<br />
Serua 19,282 0.9519 0.9500 217.7 217.3 11,289.7 11,267.5<br />
Tailevu 58,957 0.9911 0.9524 693.0 666.0 11,754.3 11,295.6<br />
Source: Estimations by Assessment Team.<br />
44<br />
<strong>Fiji</strong> Bureau of Statistics, Report on the 2008-09 Household Income and Expenditure Survey for <strong>Fiji</strong>, Suva, <strong>Fiji</strong>, 2009.<br />
Tropical Cyclone Winston, February 20, 2016<br />
41
FIJI Post-Disaster Needs Assessment<br />
2.3.2 Composite Index on Quality of Life<br />
An equal-weight, composite quality of life index was developed when combining the different sectoral indexes described<br />
above, for both pre- and post-disaster conditions in all affected provinces of <strong>Fiji</strong>. Table 21 and Figure 15 show such<br />
estimated values. Based on the quality of life estimates, determining the areas where people live that were most affected<br />
by the disaster is possible.<br />
Table 21: Pre- and Post-Disaster Composite Quality of Life Index by Province<br />
Province<br />
Quality of Life Index<br />
Pre-Disaster<br />
Post-Disaster<br />
Ba 0.9805 0.7737<br />
Bua 0.8453 0.5604<br />
Cakaudrove 0.8518 0.5352<br />
Kadavu 0.8242 0.8172<br />
Lau 0.5863 0.4931<br />
Lomaiviti 0.9067 0.5167<br />
Macuata 0.9905 0.9778<br />
Nadroga 0.9011 0.8395<br />
Naitasiri 0.9772 0.9369<br />
Namosi 0.7572 0.6214<br />
Ra 0.7601 0.2226<br />
Rewa 1.0155 0.9542<br />
Rotuma 0.9461 0.9441<br />
Serua 0.8588 0.7846<br />
Tailevu 0.8194 0.7418<br />
Source: Estimations by Assessment Team.<br />
1.0000<br />
0.9000<br />
Quality of Life Index<br />
0.8000<br />
0.7000<br />
0.6000<br />
0.5000<br />
0.4000<br />
0.3000<br />
0.2000<br />
Ba<br />
Bua<br />
Cakaudrove<br />
Kadavu<br />
Lau<br />
Lomaiviti<br />
Macuata<br />
Nadroga<br />
Naitasiri<br />
Namosi<br />
Ra<br />
Rewa<br />
Rotuma<br />
Serua<br />
Tailevu<br />
Pre-Disaster<br />
Post-Disaster<br />
Figure 15: Pre- and Post-Disaster Quality of Life Index by Province<br />
Source: Estimations by Assessment Team.<br />
42 Tropical Cyclone Winston, February 20, 2016
FIJI Post-Disaster Needs Assessment<br />
2.3.3 Most Affected Provinces<br />
The analysis undertaken reveals the most affected population, in terms of declining quality of life, which is very relevant in<br />
order to define and quantify the geographical areas that will require post-disaster needs assistance to achieve recovery and<br />
reconstruction. The most affected provinces are shown in Figure 16 as well as in the map in Figure 17.<br />
Kadavu<br />
Naitasiri<br />
Rewa<br />
Tailevu<br />
Serua<br />
Lau<br />
Namosi<br />
Ba<br />
Bua<br />
Cakaudrove<br />
Lomaiviti<br />
Ra<br />
0 0.05 0.10 0.15 0.20 0.25 0.30 0.35 0.40 0.45<br />
Figure 16: Most Affected Provinces in Terms of Decline in Quality of Life<br />
Source: Estimations by Assessment Team.<br />
Decline in Composite Quality of Life Index<br />
Figure 17: Decline in Quality of Life by Province<br />
Source: Estimations by Assessment Team.<br />
Tropical Cyclone Winston, February 20, 2016<br />
43
FIJI Post-Disaster Needs Assessment<br />
Ra Province was by far the most affected in terms of decline in quality of life. First, its housing index presently stands at<br />
the lowest in the country at 0.37, after declining from 0.92. Second, its decline in access to safe water supply now is the<br />
second lowest in the country, after declining from 0.78 to 0.26. The post-disaster index in access to sanitation facilities is<br />
0.22, down from a pre-disaster level of 0.31. Access to the electricity grid after the disaster is less than 0.10, from a predisaster<br />
level of 0.58. The destruction of schools has been extensive, and the post-disaster education index is now less<br />
than 0.10. Because of the disaster, personal income is expected to decline by about 10 percent.<br />
Lomaiviti Province is the second most affected. The housing index after the disaster is 0.38 – the second lowest in the<br />
country – after many houses were destroyed. The index on direct access to safe water supply declined from 0.92 to<br />
0.50. Direct access to sanitation facilities that, prior to the disaster showed a very low index of less than 0.03, is presently<br />
near zero. In terms of direct connection to the FEA electricity system, the index declined from 0.56 to 0.15. Again, the<br />
destruction of schools was extensive, bringing the education index to only 0.22. Personal income decline is expected to<br />
be the highest in the country at nearly 33 percent.<br />
Cakaudrove Province is the third most affected. The housing index stands at 0.43, the third lowest in the country. Safe<br />
water supply access declined from a pre-disaster level of 0.88 to 0.53. In terms of access to safe sanitation facilities, the<br />
index declined from 0.13 to nearly zero. The index of direct connection to the FEA electricity grid, which was 0.29 before<br />
the disaster, now stands at nearly nil. Again, due to the widespread destruction of school facilities, the education index<br />
presently stands as 0.46. Personal income decline is the second highest for the country, at about 26 percent.<br />
Bua Province is the fourth most affected. The housing index decreased from 0.92 to 0.55. The access to safe water supply<br />
index declined from 0.83 to 0.48. The sanitation index had a very low value of 0.34 before the disaster and presently stands<br />
at nearly zero. No data on access to electricity in isolated systems is available and the province does not receive electricity<br />
from the FEA. A relatively large number of schools were destroyed and the post-disaster education index stands at 0.71.<br />
Personal income decline has been estimated at about 22 percent.<br />
Lastly, Ba Province sustained a decline of nearly 15 percent in its housing index. The index on access to safe water services<br />
sustained a moderate decline, from a pre-disaster value of 0.91 to a post-disaster level of 0.77. In terms of access to<br />
sanitation facilities, the index declined from a low pre-disaster value of 0.14 to nearly zero. In terms of access to electricity,<br />
the respective index sustained a moderate decline, from a pre-disaster level of 0.81 to a post-disaster ratio of 0.66. Due<br />
to extensive destruction of school facilities, the education index dropped to 0.40. Personal income decline is estimated to<br />
be about 8 percent.<br />
2.3.4 Use of the Quality of Life Index as a Measure of<br />
Recovery<br />
In addition to identifying the most affected provinces and populations, the composite quality of life index may be used as<br />
a measure of recovery over time. Quantification of this index may be undertaken every six months or year to ascertain the<br />
progress of recovery and reconstruction plans.<br />
44 Tropical Cyclone Winston, February 20, 2016
FIJI Post-Disaster Needs Assessment<br />
Damage to roadway in Cakaudrove Province on Vanua Levu<br />
Source: Ministry of Infrastructure<br />
45
3.<br />
Namuaimada village, Ra Province, Viti Levu<br />
Source: Vlad Sokhin/World Bank<br />
DAMAGE, LOSSES AND<br />
NEEDS BY SECTOR<br />
46 Tropical Cyclone Winston, February 20, 2016
FIJI Post-Disaster Needs Assessment<br />
3.1 Productive Sectors<br />
3.1.1 Agriculture<br />
Summary<br />
For the purpose of this PDNA, the agriculture sector is defined to include the following five subsectors: crops, sugar cane, 45<br />
livestock, fisheries and forests. In total, the five subsectors made up 9.4 percent of the 2014 GDP, including 5.4 percent<br />
for crops, 0.8 percent for sugar cane, 1.4 percent for livestock, 0.8 percent for forestry and 1.1 percent for fisheries. Crops<br />
and livestock constitute 72 percent of the sector’s contribution to GDP, followed by fisheries (11.7 percent), sugar cane (8.3<br />
percent) and forestry (8 percent). 46 The agriculture sector accounts for 45 percent of total employment in the country, with<br />
women comprising about 37 percent of those employed in the sector. 47 A large share of the population is also engaged in<br />
informal and subsistence agriculture, which remains a major source of livelihoods across the country.<br />
Of the five subsectors, the crops subsector was the most affected by TC Winston (contributing to 40 percent of total<br />
damage and loss for the sector), followed by fisheries (38 percent), sugar cane (14 percent), forestry (5 percent) and<br />
livestock (3 percent). Permanent crops, such as kava and coconut, were the most impacted by the cyclone, but seasonal<br />
vegetables and annual crops, such as cassava and taro, also suffered significant losses. Livestock subsector damage and<br />
losses occurred mainly in the Western and Central Divisions, mostly affecting dairy, beef, poultry, pigs and apiculture. In the<br />
forestry subsectors, the timber industry was impacted by high winds resulting in damage to infrastructure and trees, mostly<br />
in the Western Division. The fisheries sector was also impacted, with the greatest effect on artisanal fisheries and commercial<br />
aquaculture. Severe damage to coral<br />
reefs is expected, as well as substantial<br />
3%<br />
5%<br />
and sustained loss in artisanal fisheries<br />
38%<br />
catches for the next decade.<br />
The total value of damage and<br />
production losses in agriculture<br />
amounts to F$542 million. Recovery<br />
needs should focus on supplying<br />
emergency inputs that will enable<br />
farmers to get back on their feet and<br />
promote a more resilient agriculture<br />
sector to withstand future shocks.<br />
Reconstruction needs will focus on the<br />
medium- to long-term infrastructural<br />
works and building technical capacity<br />
to BBB.<br />
$250<br />
14%<br />
40%<br />
Figure 18: Damage and Losses to Agriculture by Subsector (F$ million)<br />
Source: Estimations by Assessment Team.<br />
Forestry, $29.3, 5%<br />
Livestock, $14.3, 3%<br />
Sugar cane, $75.3, 14%<br />
Crops, $216.4 40%<br />
Fisheries $206.5, 38%<br />
$200<br />
F$ million<br />
$150<br />
$100<br />
$50<br />
$0<br />
Central Eastern Northern Western Damage<br />
Figure 19: Damage and Losses to the Agriculture Sector by Division (F$ million)<br />
Source: Estimations by Assessment Team.<br />
Losses<br />
Total effects<br />
45<br />
Sugar cane has a special status and a dedicated ministry in <strong>Fiji</strong>, which explains why it is considered as a separate subsector in this PDNA,<br />
independently from crops.<br />
46<br />
Based on the latest national accounts data (Macro Division- SPO, 2016). The crops and livestock subsectors are divided into the following<br />
components: formal non-government agriculture, subsistence agriculture, informal agriculture and general government agriculture.<br />
47<br />
EUS 2010-2011.<br />
Tropical Cyclone Winston, February 20, 2016<br />
47
FIJI Post-Disaster Needs Assessment<br />
Agriculture Sector Background<br />
The five subsectors included in the agriculture sector are divided across three ministries: crops and livestock under the<br />
Ministry of Agriculture (MoA); sugar cane under the Ministry of Sugar; and fisheries and forestry under the Ministry of<br />
Fisheries and Forests.<br />
Crops: The crops subsector represented an average of 57.1 percent of total agricultural GDP (5.4 percent of total GDP).<br />
Dominant subsistence crops include taro, cassava, yam, banana, plantain and leafy vegetables. Copra, ginger, taro and<br />
Bilateral Quarantine Agreement commodities 48 are the major export crops and an important source of cash income for<br />
many rural households. A significant number of farming households derive income from taro, cassava, kava and copra.<br />
However, due to transportation and other logistical constraints associated with geographical conditions, remoteness and<br />
isolation, many rural households find it difficult to access markets for cash crops.<br />
Sugar Cane: The sugar subsector contributes 8.3 percent of<br />
agriculture GDP (GDP 2014) (0.8 percent of total GDP) and provides<br />
employment to some 51,000 people. The subsector directly or<br />
indirectly supports more than 200,000 people, or nearly one-quarter of<br />
the <strong>Fiji</strong>an population, mainly in the Western and Northern Divisions. The<br />
sugar industry has been in decline for the past decade and is now half<br />
its 2006 production value mainly due to high milling inefficiencies, low<br />
farm productivity and high production costs. 49 The industry is at risk<br />
of further decline following the expiry of <strong>Fiji</strong>’s preferential access to the<br />
European Union’s sugar markets in October 2017, further exacerbated<br />
by damage and losses caused by TC Winston. A sugar sector revival<br />
strategy is currently underway, which focuses on improving on-farm<br />
productivity, increasing cane quality, reducing logistics costs, tapping<br />
into opportunities for further value addition, and effectively utilizing<br />
sugar byproducts.<br />
Flooded Sugar Cane crops in Lomolomo area<br />
Source: Henri Loze/World Bank<br />
Livestock: Livestock production represented an average of 15 percent<br />
of total agricultural GDP (1.4 percent of total GDP) between 2011<br />
and 2014. <strong>Fiji</strong> is self-sufficient in poultry, pigs, poultry meat and eggs.<br />
The livestock subsector is dominated by large semi-commercial and<br />
commercial pig, dairy, layer and broiler farms. Most beef and sheep<br />
production is carried out under subsistence production. Cooperative<br />
smallholder milk production involves some 10,000 small dairy herds,<br />
operated under semi- or fully commercial conditions. Broiler and layer<br />
production are fully commercialized and meet <strong>Fiji</strong>’s demand for poultry,<br />
meat and eggs. Subsistence livestock production remains widespread,<br />
constituting a small percentage of total livestock output, but providing<br />
significant income generation for large numbers of rural households.<br />
Although the subsector has been marked by a gradual transformation<br />
from subsistence to semi-commercial farming, many rural households<br />
continue to raise subsistence-level livestock for food security, extra<br />
cash income and meeting customary obligations.<br />
Fisheries: Fisheries represented an average of 11.7 percent of total agricultural GDP (1.1 percent of total GDP). The<br />
fisheries subsector includes offshore fisheries, inshore fisheries and aquaculture. Offshore fisheries are a significant<br />
contributor to the economy through offshore tuna fishing. Inshore fisheries are dominated by subsistence fishing involving<br />
half of rural households. 50 The main aquaculture products include blacklip pearl, tilapia, freshwater prawns, shrimp and<br />
seaweed. Bêche-de-mer, giant clam and mud crab are additional products. In recent years, aquaculture has gained more<br />
prominence in the fishing sector resulting from the increasing recognition that coastal fisheries resources in <strong>Fiji</strong> are either<br />
fully exploited or significantly over-exploited and further development of coastal fisheries would be unsustainable. The<br />
establishment of marine protected areas within the qoliqoli (customary fishing areas) and other marine waters is being<br />
promoted to conserve and protect fish stocks to ensure sustainable levels in the future. Also being pursued is the regulation<br />
48<br />
<strong>Fiji</strong> exports of fresh agricultural products are governed by the Bilateral Quarantine Agreements (BQA) that have been negotiated on a<br />
country to country basis. At present, <strong>Fiji</strong> has BQAs for fruit fly products such as papaya, mango, eggplant and breadfruit, as well as other<br />
fresh exports, such as okra and chiles. A range of frozen and cooked products also have access to export markets, mainly in New Zealand,<br />
Australia and the United States.<br />
49<br />
These include: the low rate of replanting of new sugar cane field; abandonment of existing cane fields; urban migration of cane farmers;<br />
rapid labour exit from cane production and slow adoption of labour-saving technologies; nonrenewal of cane leases; and aging cane<br />
farmers.<br />
50<br />
<strong>Fiji</strong> National Agricultural Census 2009, Department of Agriculture, Economic Planning and Statistics Division Report.<br />
48 Tropical Cyclone Winston, February 20, 2016
FIJI Post-Disaster Needs Assessment<br />
of commercial fishing licenses, replenishment of marine ecosystems, and the introduction of alternative fishing methods,<br />
such as the use of fish aggregating devices (FADs) and small-scale fish farming in ponds.<br />
Forestry: Forestry represented an average of 8 percent of total agricultural GDP (0.8 percent of total GDP). Approximately<br />
56 percent of <strong>Fiji</strong>’s land area is forested. The country’s forest resources can be grouped into two main classes: native<br />
forests of mainly indigenous species; and the man-made forests of exotic softwood and hardwood plantations. Currently,<br />
native forests constitute 87 percent of forests, softwood forests around 8 percent and hardwood forests approximately 6<br />
percent.<br />
Assessment of Disaster Effects on the Agriculture Sector (F$542 million)<br />
Damage to assets and production losses were assessed and estimated for the five agricultural subsectors. The total effects<br />
of TC Winston on crops, livestock, sugar, fisheries and forestry is F$542 million, of which F$80.3 million is attributable to<br />
damage and F$460.7 million is attributable to loss.<br />
Damage to Agriculture Sector (F$81 million)<br />
Crops: The total value of damage in the crops subsector was estimated at F$8.5 million. Most of the damage included<br />
the total or partial destruction of nurseries, copra driers, farm roads, public buildings and machinery, and total damage<br />
(stock losses) to permanent cash crops, such as coconut, kava, cocoa and sugar cane. Estimates show that damage to<br />
the crops subsector represents 11 percent of total damage to the agriculture sector (Table 22). Most of the damage in the<br />
crops subsector occurred in the Northern, Eastern and Western Divisions, mainly in the provinces of Cakaudrove, Bua,<br />
Lomaiviti, Ba, Lau, specifically Vanua Balavu and surrounding islands.<br />
Sugar Cane: Estimated value of damage to this subsector is F$21.8 million, representing 27 percent of total sector<br />
damage. For the sugar cane subsector, damage was mainly sustained to access roads, plants, farm sheds and stores, sea<br />
bunds and major drainage systems. Most of the damage occurred in the Western Division, which has the highest sugar<br />
cane production.<br />
Livestock: The estimated value of damage to the livestock subsector was F$9.2 million, which represents around 23<br />
percent of total damage to the sector. Fences, livestock and milking sheds, beehives and infrastructure were damaged<br />
and animals died. Most of the damage occurred in the Western Division (57 percent), followed by the Central Division (29<br />
percent), Northern Division (8 percent) and Eastern Division (6 percent).<br />
Fisheries: Damage to the fisheries subsector is valued at over F$40.7 million 51 , representing 51 percent of total damage to<br />
the agriculture sector. The damage assessment covered main fisheries and aquaculture assets, including boats, engines,<br />
fishing gear, fish ponds, farm equipment, farm buildings (including sheds and tanks), planting materials, farm stock,<br />
hatcheries, fences and fish feed. Ice plants, nurseries, hatcheries, stations and quarters at 13 government stations also<br />
sustained damage. The most significantly affected areas were the coastal subsistence fisheries, with a value of F$27.7<br />
million, accounting for about 68 percent of total damage in the subsector. Coastal commercial fisheries sustained damage<br />
amounting to F$5.3 million (13 percent), while damage to aquaculture was valued at F$3.7 million (9.5 percent). Out of the<br />
23 existing government stations, 13 of them sustained damage at a cost of F$3.8 million (9.5 percent).<br />
Forestry: The estimated value of damage to the forestry subsector totaled F$1.1 million. 52 The Western Division sustained<br />
the most damage, accounting for 59 percent of all damage to the subsector, followed by the Northern Division (27 percent),<br />
Central Division (12 percent) and Eastern Division (2 percent). Assets damaged include nurseries, sawmills (static and<br />
portable) and a solar kiln. Damage to trees included mature trees in plantations and native forests, with significant damage<br />
to pine, teak and mahogany in the Western Division. Significant damage to teak in Ra, mahogany in Ba and pine plantations<br />
in the Central, Eastern and Northern Divisions also occurred.<br />
Losses to Agriculture Sector (F$461 million)<br />
Crops: Estimated production losses in the crops subsector was F$207.9 million (Table 22 ). The cyclone caused significant<br />
losses to cash crops (kava, taro and cassava), tree crops (coconut, breadfruits, citrus and cocoa), food gardens and food<br />
security crops (kumala, cassava, taro and vegetables). Most of the production losses affected kava (55 percent), a crop<br />
that is vulnerable and very fragile to strong winds, followed by taro (13 percent) and coconut (7 percent). Losses in cassava,<br />
banana and assorted vegetables accounted for 17 percent of total losses. A major share of the losses occurred in areas<br />
badly affected by the cyclone, mainly islands and areas within the provinces of Cakaudrove, Lau, Ba, Ra and the Lomaiviti<br />
Group.<br />
51<br />
Damage and losses to <strong>Fiji</strong>’s lead pearl farm are not included here, but are considered separately in this PDNA under the commerce<br />
and industry sector. The farm has significant downstream manufacturing components. Pearl primary production farms, and pearl spat<br />
catching operations are considered under fisheries.<br />
52<br />
This figure is probably underestimated as new reports from the private sector indicate further significant damage in the forestry<br />
subsector.<br />
Tropical Cyclone Winston, February 20, 2016<br />
49
FIJI Post-Disaster Needs Assessment<br />
Sugar Cane: Production losses in the sugar cane subsector are approximately F$53.6 million, which represent 12 percent<br />
of total sector losses. Most of the losses were sustained in the form of uprooted crops (mainly in the Western Division),<br />
higher input costs and lower output prices. The production loss of crops is expected to result in lower sugar production,<br />
which will negatively affect revenue and foreign exchange earnings for the current calendar year.<br />
Livestock: Estimated losses to the livestock subsector were F$5.1 million, which represents around 1 percent of total<br />
losses to the sector. These include production losses due to the death of animals and decline in meat, honey and milk<br />
production. Substantial quantities of fresh milk were lost due to power failures at milk chilling centres, and road blockages<br />
by wind-blown debris that prevented milk trucks from collecting milk from these centres. Most of the livestock losses were<br />
sustained in the Western Division (61 percent) followed by the Central Division (26 percent), Northern Division (7 percent)<br />
and Eastern Division (6 percent).<br />
Fisheries: The fisheries subsector sustained a high value of production losses, at over F$165.9 million. This was the result<br />
of extensive damage to fisheries assets and the long-term losses of production capacity of coral reef ecosystems and other<br />
fish habitats, which will significantly and durably affect rural marine-based livelihoods. A substantial part of the losses is<br />
attributed to subsistence fishing valued at F$119.7 million (72.1 percent) followed by commercial artisanal fisheries valued<br />
at F$43.6 million (26.3 percent) and semi-commercial fisheries worth $2.6 million (1.6 percent). It will take an estimated<br />
12 years for subsistence and commercial fisheries to get back to their pre-disaster production levels, provided that sound<br />
resource management is applied and no other major natural disaster occurs in the meantime. The aquaculture sector<br />
should only take a year or two to be rehabilitated, provided that the necessary resources are identified and deployed to<br />
the affected areas.<br />
Forestry: Estimated production losses to the forestry subsector totaled F$28.2 million. Native forests accounted for a<br />
substantial portion of total losses (70 percent), while plantation forests (exotic species) accounted for the remaining 30<br />
percent. The Western Division sustained the most losses (62 percent), followed by the Northern Division (28 percent),<br />
Central Division (7 percent) and Eastern Division (3 percent). Considerable production losses were recorded with Raintree<br />
in Ra, Dakua in Ba and Kaudamu in Bua.<br />
Table 22: Damage and Losses to Agriculture by Subsector (F$ million)<br />
Subsector Damage Losses Total Effects Private (%) Public (%)<br />
Crops 8.5 207.9 216.4 99 1<br />
Sugar Cane 21.8 53.6 75.4 70 30<br />
Livestock 9.2 5.1 14.3 98 2<br />
Fisheries 40.7 165.9 206.6 98 2<br />
Forestry 1.1 28.2 29.3 70 30<br />
Sector Total 81.3 460.7 542.0 93 7<br />
Source: Estimations by Assessment Team.<br />
Table 23: Damage and Losses to Agriculture by Division (F$ million)<br />
Division Damage Losses Total Effects Private (%) Public (%)<br />
Central 12.2 83.8 96.0 98 2<br />
Eastern 7.9 37.2 45.1 91 9<br />
Northern 17.4 189.2 206.6 96 4<br />
Western 43.8 150.5 194.3 88 12<br />
Sector Total 81.3 460.7 542.0 93 7<br />
Source: Estimations by Assessment Team.<br />
Social Impact of Damage and Losses to the Crops, Livestock, Sugar Cane, Fisheries and Forestry Subsectors<br />
The extensive destruction of food crops has seriously affected household income, food security and nutrition, with<br />
vegetables and root crop prices having increased significantly since the cyclone. An illustrative case is cassava, a staple<br />
food for <strong>Fiji</strong>ans, for which prices doubled from F$5 a heap before the cyclone to F$10 after the cyclone. The loss of<br />
vegetables and fruits, compounded by a considerable increase in vegetable prices, could place a stress on food budgets<br />
for most low-income earning households around <strong>Fiji</strong>, and make it worse off for those living in areas badly affected by the<br />
cyclone. There are also concerns that women, particularly pregnant and lactating women living in rural areas, may not get<br />
sufficient access to adequate nutritious food. Production losses are expected to last several years, the time required for fruit<br />
50 Tropical Cyclone Winston, February 20, 2016
FIJI Post-Disaster Needs Assessment<br />
trees to be replanted and begin producing again, and for fisheries catch to recover after fish return to coral reef areas. Thus,<br />
rural household income and livelihoods are expected to remain depressed over a long period of time. Households may<br />
need: support and food assistance for a longer period of time; to further diversify their activities; or retraining for other skills<br />
so other income-generating activities can be undertaken. In addition, retraining in non-traditional and non-farm economies<br />
would increase the resilience of women and girls against future disasters.<br />
Subsistence agriculture is an important form of employment and income support for rural communities. The extensive<br />
damage sustained by, and projected reduced agricultural output across, the sector will not only impact the economic<br />
performance of the country but also has welfare implications on a large number of rural households. It will affect households’<br />
ability to provide food security, nutrition and meet familial basic needs, resulting in economic hardship and eroded resilience<br />
to future shocks.<br />
From a gender perspective and in economic terms, men overall have sustained the largest damage and production losses<br />
through the combined impact on the agriculture sector. Women hold a 33 percent share of the sector, 53 representing<br />
approximately F$179 million of the total agricultural damage and losses. However, women’s losses have far reaching<br />
implications at the household level as their subsistence activities and earnings contribute directly to nutritional security<br />
and household economic welfare and foster human welfare. Reduced yield in food crops, and the potential for resulting<br />
food insecurity, could put enormous pressure on women to provide food and nutrition. An analysis of the affected crops in<br />
the Western Division shows that vegetables were the most affected, making up 24 percent of total crop losses. Damage<br />
to vegetables will not only affect direct income to women (as they are largely responsible for cultivating vegetables), but<br />
will also affect their ability to provide nutritious food within familial contexts. The loss of livestock will have an additional<br />
detrimental impact on income, food security and nutrition. An analysis of livestock indicates that 71 percent of all dead<br />
livestock include poultry (excluding commercial poultry), pigs and beehives. As smaller animals are usually under the control<br />
of women, total livestock held by women is less than those held by men; nevertheless, smaller livestock are a key source<br />
of protein and extra income. These livestock tend to be sold off first as a coping mechanism in times of hardship, further<br />
eroding women’s asset base and leaving them even more vulnerable to future shocks.<br />
Moreover, efforts to provide food security at the household level, particularly in the context of extensive damage to crops<br />
and offshore fisheries, will increase the work burden for women in foraging for food and fishing in mangroves, leaving<br />
them little time for other income-generating activities. Due to their productive role, women are dependent on accessible<br />
natural resources for alternative income sources. Women particularly rely on non-timber forest products for mat and basket<br />
weaving, which have also been heavily affected by the cyclone. All economic activities around voivoi (pandanus) have<br />
reportedly come to a halt, and women dependent on this plant may be faced with dwindling livelihoods options at a time<br />
when they need income the most, thus impeding their recovery.<br />
In fact, the combination of key factors, including lower income, livelihood dependence on subsistence farming, mobility<br />
constraints which limit availability and ability to look for other employment opportunities, and increased reproductive<br />
responsibilities 54 may increase women’s economic hardship and economic dependence on their spouses.<br />
Recovery and Reconstruction Needs for the Agriculture Sector (F$161 million)<br />
The total value of recovery and reconstruction needs for the agriculture sector is estimated at F$161 million, of which F$65<br />
million is required for recovery and F$96 million is required for reconstruction needs.<br />
Implementation of this recovery strategy will maintain and strengthen inclusion, and incorporate clear identification and<br />
participation of vulnerable groups, with a focus on gender and age where necessary. It will also include nutrition and food<br />
security concerns through the medium and longer term.<br />
Given the loss of income and major food access issues resulting from TC Winston, many small and subsistence farmers are<br />
now facing significant hardship. The aims of the recovery and reconstruction efforts in the agriculture sector are primarily to<br />
support the re-establishment of food security sources in affected communities, revive economic activity across the sector<br />
and strengthen farmers’ capacity to be more resilient to similar future shocks in accordance with the principles of BBB. The<br />
proposed recovery programmes specifically focus on facilitating access to good quality agricultural inputs, such as seeds,<br />
tree seedlings and fingerlings, as well as supporting animal restocking. Reconstruction will be focused on rehabilitating<br />
damaged infrastructure, such as roads, drainage administration buildings, equipment and machinery, and other damaged<br />
farming assets.<br />
The government instituted recovery programmes immediately after the cyclone in collaboration with the Food Security and<br />
Livelihood Cluster (which includes NGOs and UN agencies). Short-, medium- and long-term post-cyclone recovery and<br />
reconstruction needs have been identified, some of which are incorporated into the PDNA.<br />
53<br />
ADB 2015: <strong>Fiji</strong> Country Gender Assessment.<br />
54<br />
Women and girls in <strong>Fiji</strong> are responsible for more than 74 percent of household work compared to 26 percent for men.<br />
Tropical Cyclone Winston, February 20, 2016<br />
51
FIJI Post-Disaster Needs Assessment<br />
Crops and Livestock: In the crops and livestock subsectors, short-term activities will address immediate food security<br />
needs by restoring crops and livestock production through land clearance, distribution of agro-inputs (seeds, seedlings,<br />
suckers, cuttings and fertilizers) and provision of feeds and fodder, veterinary drugs and day old chicks. Support is<br />
also needed with respect to land preparation, clearing existing drainage systems, pasture rehabilitation, providing farm<br />
machinery and equipment, and rehabilitating critical transport and infrastructure, such as pasture fencing and livestock.<br />
Immediate recovery and reconstruction activities should target the most affected population within government priority<br />
areas irrespective of gender or age.<br />
In the medium to long term, further resources would be required for restoring the crop and livestock economy, biosecurity<br />
and plant protection monitoring. There is also a medium- to long-term need to improve disaster preparedness in terms of<br />
developing solid baseline data, as well as post-disaster assessment, communications, and monitoring and evaluation tools<br />
for crops and livestock. Increasing disaster resilience will also be essential through improving land resource management,<br />
establishing new drainage systems where required, distributing resilient crops, increasing awareness about traditional<br />
disaster management and introducing modern technology where possible, and promoting climate-smart and resilient<br />
farming techniques and systems.<br />
Sugar Cane: Recovery and reconstruction for the sugar sector will need to address not only damage and losses to sugar<br />
cane growers, but also to the wider industry within which sugar cane production occurs. A number of basic components<br />
and infrastructure has been destroyed or compromised, putting at risk long-term safety and operability (for example, the<br />
drainage systems). A number of essential services to farmers have been directly constrained since the cyclone, including<br />
the near collapse of the entire improved seed cane production system and the redirection of the Sugar Cane Growers Fund<br />
resource towards quick emergency loans to farmers. For the sugar cane subsector, recovery and reconstruction will focus<br />
on cane production through the production of seedlings and planting of new canes, provision of farmer support services,<br />
and capacity building for the Ministry of Sugar and the broader sugar industry. These actions should help bring the industry<br />
back to its pre-TC Winston level. Immediate subsector actions should be linked to a longer-term set of actions that need to<br />
drive the industry forward, in alignment with the Sugar Action Plan, 55 with an emphasis on the principles of BBB.<br />
Forestry: For the forestry subsector, the short-term focus will primarily be on clearing and salvaging fallen trees from<br />
plantation and licensed native forests, which will require acquiring and mobilizing new portable saw mills to support the<br />
salvaging process, including trainings. In the medium to long term, the main focus will be on reforestation of plantation<br />
and native forests. Starting in the short-term, strengthening nurseries will be required so that replanting programmes can<br />
operate smoothly from the medium term onwards.<br />
Fisheries: In the fisheries subsector, the main thrust of short-term needs is to address the food security situation by restoring<br />
the flow of fresh fish products from fisheries and aquaculture as quickly as possible. This ranges from the distribution of<br />
fishing equipment kits to both licensed and non-licensed fisheries enterprises, to the provision of fish pellet feed to fish<br />
farmers so that fish remaining in small-scale ponds can soon be reared to a harvestable size. Resources are required to<br />
repair boats and engines, replace missing equipment, and restore damaged or breached ponds for fish restocking. Rapid<br />
deployment of FADs in the impact corridor will help provide an alternative livelihood to fishers, and relieve pressure on coral<br />
reef fisheries, which suffered ecosystem damage and will be subject to a long recovery time.<br />
Medium-term needs highlight the cost of reconstruction, which is considerable for the private sector. Many boats, engines<br />
and fishing gears have been lost, particularly in the non-licensed fisheries sector. Government fishing and aquaculture<br />
infrastructure has been severely damaged, with two hatchery facilities (giant clam and tilapia) completely wiped out. Effort<br />
should be placed on strengthening the FAD programme in <strong>Fiji</strong> to maintain and increase FADs as an alternative means of<br />
fishing. Long-term surveys of impacted coral reefs will be needed to monitor their recovery, and provide a scientific basis for<br />
fisheries management and coastal development. Long-term strategies are needed to increase the visibility of non-licensed<br />
fishermen in the economy. Disaster resilience and preparedness of impacted fisheries and aquaculture must be assessed<br />
and further strengthened. <strong>Fiji</strong>’s leading aquaculture industry of pearl farming has been particularly hard hit, and merits<br />
special attention during post-cyclone recovery efforts.<br />
55<br />
The Sugar Action Plan is a new comprehensive ten-year action plan (from 2013 to 2022) for the <strong>Fiji</strong>an sugar industry, and is a forwardlooking,<br />
industry-led and action-oriented framework implemented through a flexible and adaptive approach. The Sugar Action Plan seeks<br />
to improve the quantity and quality of sugar cane grown in <strong>Fiji</strong>, enhance the efficiency of milling operations, diversify revenue streams and<br />
implement longer-term restructuring actions related to production unit size, commercialization and industry governance.<br />
52 Tropical Cyclone Winston, February 20, 2016
FIJI Post-Disaster Needs Assessment<br />
Table 24: Total Recovery and Reconstruction Needs for the Agriculture Sector (F$ million)<br />
Subsector Recovery Reconstruction Resilience Total<br />
Crops 30.3 9.4 39.7<br />
Sugar 12.4 28.7 41.1<br />
Livestock 1.2 9.6 10.8<br />
Fisheries 18.0 47.2 65.2<br />
Forestry 3.4 1.2 4.6<br />
Total 65.3 96.1 161.4<br />
Source: Estimations by Assessment Team.<br />
Note: A detailed breakdown of recovery needs by sector is included in Annex 2.<br />
3.1.2 Commerce and Manufacturing<br />
Summary<br />
The commerce and manufacturing sector contributes close to 24.5 percent of <strong>Fiji</strong>’s GDP. Damage from TC Winston to<br />
buildings and production capability has and will continue to affect the sector through increased costs and reduced activity.<br />
Total damage is estimated at F$72.9 million and economic losses are estimated at F$69.9 million, with total effects of<br />
F$142.8 million. The majority of the damage and losses were incurred in the Western Division, largely attributed to sugar<br />
manufacturing and associated damage and losses. The private sector accounted for around 51 percent of total effects.<br />
The cost of the recovery and reconstruction needs are estimated at F$61.3 million and considerable support to avoid a<br />
prolonged reduction in the country’s production capacity is required. Reconstruction and recovery will need to rely on a<br />
combination of subsidised loans, commercial finance, insurance, grants, private savings and exemptions. The weight given<br />
to the respective instruments and their detailed design will be decided upon following further assessment. Development<br />
partner support will be necessary, and the financial and insurance sectors must play a proactive role by, for example,<br />
processing insurance claims and loan applications in a timely manner.<br />
Table 25: Total Damage and Losses in the Commerce and Manufacturing Sector (F$ million)<br />
Damage Losses Total Effects<br />
Commerce 2.5 8.0 10.5<br />
Manufacturing 70.4 61.9 132.3<br />
Total 72.9 69.9 142.8<br />
Source: Estimations by Assessment Team.<br />
Commerce and Manufacturing Sector Background<br />
As mentioned, commerce and manufacturing accounted for 24.5 percent of GDP in 2014 (F$1,747.5 million). Contributions<br />
by subsector are reported in Table 26.<br />
The manufacturing subsector is a major component of the economy, contributing around 13.2 percent of GDP in 2014. 57<br />
The manufacturing subsector in <strong>Fiji</strong> includes components of food and beverage manufacturing and other manufacturing<br />
activities, ranging from cigarettes, apparel, footwear, paper products, plastic and rubber products, furniture, basic metals,<br />
coachworks, concrete products, and timber and wood products.<br />
Total employment generated from manufacturing was around 25,000 people in 2012, with women making up 33 percent<br />
of the workers. 58 Around 56 percent of the female workers are employed in the textile, clothing and footwear industries.<br />
The commerce subsector contributed 11.3 percent of GDP in 2014. Commerce includes vehicle trade, supermarkets,<br />
textile and clothes traders, hardware traders, book traders, fuel and oil traders, and product distributors. The subsector<br />
is primarily driven by the sale of motor vehicles and parts, fuel wholesale, hardware, and clothing and textiles. Investment<br />
in the commerce subsector stood at F$59.1 million in 2012, 59 during which the sector employed approximately 25,000<br />
people of which 34 percent were female. Fifty-five percent of female workers were employed in the retail sector, in particular<br />
household equipment in specialised stores.<br />
56<br />
Estimate does not include insurance claims, which were not processed at the time of assessment.<br />
57<br />
2014 FBOS provisional GDP statistical release (2011 Base). Figures used are nominal GDP estimates.<br />
58<br />
FBOS Manufacturing sector survey, 2012.<br />
59<br />
FBOS Wholesale and retail survey, 2012.<br />
Tropical Cyclone Winston, February 20, 2016<br />
53
Traders return to Rakiraki Market after the cyclone<br />
Source: UN Women/Ellie van Baaren<br />
Table 26: Contribution to GDP by Subsector (F$ million)<br />
2012 2013 2014<br />
Manufacturing 822.0 892.4 940.2<br />
Commerce Wholesale and Retail Trade 701.0 754.9 807.3<br />
Total in Sector 1,523.0 1,647.3 1,747.5<br />
Total GDP 7,119.6 7,727.7 8,552.9<br />
Source: <strong>Fiji</strong> National Accounts 2014.<br />
Assessment of Disaster Effects on the Commerce and Manufacturing Sector (F$143<br />
million)<br />
TC Winston brought about the destruction or damage of assets in both the manufacturing and commerce subsectors,<br />
including destruction of premises, equipment, machinery, and stocks of raw materials and finished products. In addition,<br />
the disaster caused production and sales disruptions derived from activity stoppage caused by the damage to assets<br />
and temporary absence of labour and electricity. In addition, because of the disruption to the food production chain,<br />
industries and commercial establishments will face future decline in production and sales, arising from production losses in<br />
agriculture, livestock and fisheries, which will become evident during harvest time. These subsequent production losses will<br />
be sustained in the industrial and commercial enterprises that were damaged and in undamaged entities as well.<br />
In the assessment of disaster effects, damage and losses were estimated through a combined process of field visits and<br />
telephone interviews with affected enterprises and analysis of sector specific issues.<br />
Damage (F$73 million) and Losses (F$70 million) to the Commerce and Manufacturing Sector<br />
Commerce: In the wholesale and retail commerce sector, 43 business establishments were partially affected, sustaining<br />
damage to buildings, equipment and stocks. A survey that covered enterprises accounting for 36 percent of the total trade<br />
sector output found that sales interruptions occurred over an average of four days due to electricity outages and limited<br />
road access immediately after the cyclone. Estimates were also made regarding future losses in sales of food products in<br />
54 Tropical Cyclone Winston, February 20, 2016
FIJI Post-Disaster Needs Assessment<br />
the commerce subsector arising from primary losses in the agriculture, livestock and fisheries subsectors. A good number<br />
of large retail outlets and the majority of wholesalers surveyed had insurance coverage. Most of the damage occurred in<br />
commercial establishments located in the Western and Northern Divisions.<br />
The total value of disaster effects for the commerce sector is estimated as F$10.4 million, of which F$2.5 million refers to<br />
the value of destroyed assets, and F$7.9 million represents decline in sales, as shown in Table 27.<br />
Manufacturing: For the manufacturing sector, information was obtained through a sample survey on: the estimated value<br />
of destroyed physical assets, including premises, equipment and machinery, stocks of raw materials for processing, and<br />
stocks of finished goods; and the value of stoppage or slowdown of production and sales and other operation-related<br />
problems (including the absence of electricity and employees). In some cases, businesses underwent higher production<br />
costs due to increased transport and electricity costs. Businesses which depended primarily on produce reported significant<br />
losses, in particular, in the pearl industry, where the only manufacturer highlighted a limited supply forecast resulting from<br />
massive damage to all pearl farms across <strong>Fiji</strong>. A total of 70 individual manufacturing companies from the Western, Northern<br />
and Central Divisions submitted their responses to the survey.<br />
In addition to production losses, a total of 554 short-term job losses in the formal sector was reported in manufacturing<br />
companies during the two weeks after the cyclone. The jobs were reinitiated once the electricity supply was fully restored.<br />
No employment or livelihood losses were reported in the informal sector.<br />
The sugar milling industry was also heavily affected. Milling facilities located in in the Western Division were significantly<br />
damaged, in particular the Penang Mill in Rakiraki, the Rarawai Mill in Ba and the Lautoka Mill. In addition, the rail network<br />
for carting cane was damaged. Impact on production due to temporary closure of the Penang Mill, the anticipated shortage<br />
of sugar cane, and higher energy and transport costs contributed to the losses. Total damage to sugar manufacturing<br />
stands at F$60.2 million and production losses were estimated at F$42.8 million.<br />
In addition, a comprehensive survey conducted by the National Centre for Small and Micro Enterprises Development found<br />
that 272 enterprises were affected. In addition, the Ministry of Industry, Trade and Tourism (MITT) conducted a survey<br />
revealing that 1,857 clients incurred damage to fixed assets (furniture, fittings, equipment and stock) and production<br />
losses. The types of businesses affected included canteens, roadside stalls, market vendors, barbershops, catering, grass<br />
cutting and handicrafts. Based on field surveys, an estimated 84 out of the 443 registered communally owned cooperatives<br />
also recorded damage and losses.<br />
The total value of disaster effects for the manufacturing subsector are estimated at F$132.4 million, of which F$70.4 million<br />
refer to the value of destroyed assets, and F$62.0 million represent the value of production decline, as shown in Table 27.<br />
Table 27: Damage and Losses in Commerce and Manufacturing by Subsector (F$ million)<br />
Commerce<br />
Damage Losses Total Effects<br />
Public Private Total Public Private Total Public Private Total<br />
Wholesale and retail trade 2.5 2.5 7.9 7.9 10.4 10.4<br />
Manufacturing<br />
Sugar milling 40.9 19.3 60.2 29.1 13.7 42.8 70.1 33.0 103.1<br />
Processing of non-sugar food and<br />
non-food products<br />
Informal sector SME<br />
manufacturing<br />
6.8 6.8 8.0 8.0 14.7 14.7<br />
3.4 3.4 11.2 11.2 14.6 14.6<br />
Manufacturing subtotal 40.9 29.5 70.4 29.1 32.9 62.0 70.1 62.3 132.4<br />
Total 40.9 32.0 72.9 29.1 40.8 69.9 70.1 72.7 142.8<br />
Source: Estimations by Assessment Team.<br />
Note: Small and medium enterprises are considered informal sector activities that contribute to the manufacturing sector, as treated in the<br />
classification of national accounts for <strong>Fiji</strong>. Small and medium enterprises and cooperative businesses are considered informal sector activities<br />
that contribute to the commerce sector, as treated in the classification of national accounts for <strong>Fiji</strong>. However, figures on these damage and<br />
losses were not readily available at the time of the assessment. They have subsequently been made available and were estimated to total<br />
F$2.07 million in damage and F$5.98 million in losses.<br />
Tropical Cyclone Winston, February 20, 2016<br />
55
FIJI Post-Disaster Needs Assessment<br />
Social Impact of Damage and Losses<br />
A significant number of manufacturing and retail operations located in the affected zone reported temporary closure for a<br />
few days following TC Winston as a result of intermittent electricity and water supply outages, and the limited accessibility<br />
of staff and customers to places of business. Wholesale operators were largely spared as they operate from outside<br />
the TC Winston-affected zone. Employees were temporarily laid off and livelihoods impacted as alternative sources of<br />
income were limited. Furthermore, most of these workers also suffered damage to their houses and subsistence crops and<br />
livestock, which compounded the impact. In particular, survey data collected found a total of 554 short-term jobs in the<br />
manufacturing sector were lost within two weeks following the cyclone. In general, for each person who lost a job, at least<br />
two to three other people presumably would be affected by this loss in their household. Alternative job opportunities were<br />
limited given the broader impact of TC Winston, which would have exacerbated the household-level impact.<br />
Around 43 percent of micro and small enterprises, which contribute to both manufacturing and commerce activities, have<br />
suffered extensive damage and losses. Of this, 38 percent are female entrepreneurs who had engaged in some form of<br />
business activities. Both women and men have sustained damage to their businesses and will continue to incur losses,<br />
particularly losses in food processing enterprises arising from primary production losses sustained in the agriculture sector,<br />
and livestock and fisheries subsectors (refer to Section 3.1.1 for more information). As savings are diverted towards<br />
meeting basic household needs and home reconstruction, there may not be enough capital available to restore businesses.<br />
Similar challenges can be anticipated for cooperatives, which along with micro and small business enterprises, employ a<br />
high number of women due to the flexibility and low-entry capital requirements.<br />
Cooperatives are also reportedly sustaining damage to assets and losses in revenue. Some cooperatives provided ecotourism<br />
services and recovery will depend not only on reconstruction of assets but broader recovery in visitor arrivals<br />
and the tourism sector. (Refer to Section 3.1.3 of this report for more information on damage and losses to the tourism<br />
sector). Recovery for SMEs and cooperatives could be further impeded due to limitations on accessing the loans and<br />
micro-finance that may be needed to inject cash into their businesses to help post-disaster recovery. Limited access to<br />
loans may be a bigger challenge for women, as they often have difficulty in accessing financial services under ordinary<br />
circumstances. Targeted intervention to support cooperatives and SMEs is, therefore, important to ensure women are not<br />
left behind in the recovery process. Recovery efforts should focus on facilitating access to soft credit and low interest rates<br />
for SMEs. Medium- and long-term skills development and direct access to external markets are also needed for women<br />
entrepreneurs to reduce their reliance on local tourist markets and to enhance their resilience against future disasters.<br />
Recovery and Reconstruction Needs for the Commerce and Manufacturing Sector (F$61<br />
million)<br />
Private businesses in the commerce and manufacturing sector have been affected by TC Winston, particularly in terms<br />
of sugar manufacturing. The total recovery and reconstruction costs are estimated at F$61.3 million 60 and considerable<br />
support to avoid a prolonged reduction in the country’s production capacity is needed. Reconstruction and recovery will<br />
need to rely on a combination of subsidised loans, commercial finance, insurance, grants, private savings and exemptions.<br />
The weight to be given to the respective instruments and their detailed design will be decided upon further assessment.<br />
Development partner support will be necessary in most parts. In addtion, the financial and insurance sectors will need to<br />
play a proactive role, with, for example, lodging and processing insurance claims in a timely manner.<br />
A number of specific recovery needs have been identified by the sugar stakeholders, in particular, repair of sugar processing<br />
equipment and vessels, and electrical and electronic control facilities. Further repairs of roofs, civil works and administrative<br />
offices will be carried out in 2017. The Penang Mill may be dismantled and options on a way forward for the mill is yet to be<br />
determined. Stoppage of the Penang Mill will have a direct consequence on transport costs to the <strong>Fiji</strong> Sugar Corporation<br />
with an additional F$25/tonne expected to cart cane from from the Penang to the Rarawai Mill in Ba. In addition, railway<br />
and road infrastructure for cane delivery requires upgrades.<br />
The short-term support identified by the commerce and manufacturing sector should not deviate attention from pursuing<br />
the long-term policy priorities identified by the government for developing these sectors as identified by the National<br />
Development Plan, the 2016 National Budget Strategy and the 2015 Trade Policy Framework. Longer-term support directly<br />
linked to coping with risk from natural disasters needs to be aligned with the National Development Plan and associated<br />
government strategies.<br />
60<br />
Damage and losses in the sector multiplied by a factor as per the Damage and Loss Assessment methodology and, based on stakeholder<br />
consultations, sugar sector specific recovery needs have been incorporated. The BBB principle has been incorporated where appropriate.<br />
Estimates do not include insurance claims, which were not processed at the time of the assessment.<br />
56 Tropical Cyclone Winston, February 20, 2016
Aerial view of damaged Volivoli Beach Resort, Rakiraki<br />
Source: Ministry of Information<br />
Table 28: Total Recovery and Reconstruction Needs for the Commerce and Manufacturing Sector (F$ million)<br />
Recovery Reconstruction Resilience Total<br />
Commerce subsector 2.0 0.9 2.9<br />
Manufacturing subsector, excluding sugar 2.0 7.4 9.4<br />
Sugar industry (less insurance) 10.7 31.4 42.1<br />
SMEs 2.6 3.0 5.6<br />
Cooperatives 0.5 0.8 1.3<br />
Total 17.8 43.5 61.3<br />
Source: Estimations by Assessment Team.<br />
Note: A detailed breakdown of recovery needs by sector is included in Annex 2.<br />
3.1.3 Tourism<br />
Summary<br />
While many hotels did suffer major impacts from TC Winston, the cyclone bypassed the tourist hotspots and hit the country<br />
during the low tourist season. International flights were reinstated after approximately only two days of disruption and a<br />
clear ‘business as usual’ message was emphasised to the primary tourism markets in the wake of the cyclone. The rapid<br />
reaction of tourism providers and the tourism industry in mitigating negative perceptions was key to minimising lost revenue<br />
through cancellations. Lessons learned from TC Evan and other disasters had been well implemented by both the tourism<br />
sector and responding authorities.<br />
Of an estimated 400 national tourism businesses, at least 75 were significantly damaged. Accommodation providers bore<br />
the brunt of the impact, with tour operators reporting little to no damage. 61 Structural damage to hotels and resorts was<br />
minimised due to the generally good standards to which they were built, but nevertheless damage of approximately F$76<br />
million was sustained across the four divisions. The majority of damage occurred at a small number of properties, the worst<br />
affected being six small, but very exclusive, island properties. These six properties constitute 76 percent of self-reported<br />
damage.<br />
61<br />
A PDNA survey was distributed through the <strong>Fiji</strong> Hotel and Tourism Association and the Society of <strong>Fiji</strong> Travel Associates (SOFTA), but no<br />
reports were received from SOFTA members by PDNA reporting deadlines. Damage reports have been obtained from 74 accommodation<br />
businesses and one tour operator (approximately 50 percent of businesses surveyed). Additional data on tour operators in the affected<br />
area was supplied by the environment team.<br />
Tropical Cyclone Winston, February 20, 2016<br />
57
FIJI Post-Disaster Needs Assessment<br />
Businesses are estimated to have lost F$44 million through cancellations and future bookings. Losses due to additional<br />
operating costs appear to have been minimal, within the range of F$4 million. TC Winston will reduce visitor numbers by<br />
an estimated 3,700, or 0.5 percent, of annual arrivals during 2016, with the majority of the impact in the second quarter<br />
of the year.<br />
Given that TC Winston had a limited impact on the national tourism sector, recovery needs are relatively modest. The<br />
properties that constitute the majority of damage and losses are believed to be well insured. Based on initial insurance<br />
industry estimates and industry self-reporting, between F$12 million and F$29 million in damage and losses are uninsured.<br />
Accessing appropriate and affordable insurance products for smaller operators needs to be addressed. A smaller, but<br />
nevertheless important, need is to continue the positive messaging regarding <strong>Fiji</strong> being open for business in 2016.<br />
Tourism Sector Background<br />
Tourism has become a cornerstone of <strong>Fiji</strong>’s socioeconomic development over the past two decades. The sector consists<br />
of over 400 hotels, resorts and backpacker accommodations, located mainly around the Western Division islands of<br />
Savusavu, Taveuni, Mamanucas and Yasawas. 62 Direct tourism earnings as a percent of nominal GDP was an average of<br />
17.6 percent between 2011 (F$1.28 million) and 2015 63 (F$1.56 billion). Earnings fluctuate throughout the year depending<br />
on seasonality of tourist arrivals. The first quarter of the year is the trough season, while the third quarter of the year is the<br />
peak season (see Figure 20).<br />
Visitor arrivals increased from 675,050 in 2011 to an estimated all-time high of 754,835 in 2015. Australia, New Zealand<br />
and the United States are the three major source markets comprising 48.7 percent, 18.4 percent and 9 percent of total<br />
visitor arrivals, respectively, as of 2015. Other markets consisting of mainly China, continental Europe and Canada make<br />
up the remaining 23.9 percent.<br />
500.0<br />
400.0<br />
F$ million<br />
300.0<br />
200.0<br />
100.0<br />
0.0<br />
Mar Jun Sep Dec Mar Jun Sep Dec Mar Jun Sep Dec Mar Jun Sep Dec<br />
2012 2013(p)<br />
Quarterly<br />
2014(p)<br />
2015(p)<br />
Figure 20: Quarterly Tourism Earnings 2012–2015<br />
Source: Estimations by Assessment Team<br />
Sector growth declined in 2012 and 2013 due to the effects of severe flooding in January 2012 and TC Evan in December<br />
2012, resulting in declining visitor arrivals and relatively stagnant earnings. However, due to swift measures implemented<br />
by government and industry stakeholders, record growth was experienced in 2014 and 2015.<br />
Tourism Earnings (F$ million)<br />
2,000.0 800<br />
1,500.0 750<br />
1,000.0 700<br />
500.0 650<br />
0.0<br />
2011 2012 2013 2014 2015 (e)<br />
600<br />
Visitor Arrivals (thousands)<br />
Figure 21: Tourism Visitor Arrivals and Earnings for 2011–2015<br />
Source: Estimations by Assessment Team<br />
Tourism Earnings<br />
Visitor Arrival<br />
62<br />
Hotel Licensing Board Database.<br />
63<br />
FBOS – Tourism Statistics Year End Release.<br />
58 Tropical Cyclone Winston, February 20, 2016
FIJI Post-Disaster Needs Assessment<br />
The number of rooms available increased from 10,211 in 2011 to 10,422 in 2015. Over the same period, average room<br />
occupancy has been 56.1 percent during the third quarter of the year (peak period). Moreover, visitors spent an average of<br />
9.5 days in <strong>Fiji</strong> as of 2015, spending an estimated F$184.96 per day.<br />
As the sector experienced positive growth, direct tourism employment increased from 11,663 jobs in 2011 to 13,247 in<br />
2015. 64 An estimated 77.7 percent of these jobs are full time employment while 22.3 percent are part time.<br />
Table 29 provides a snapshot of <strong>Fiji</strong>’s tourism sector at the end of 2015 by area. Nadi and the Coral Coast have the largest<br />
share in all parameters followed by the Mamanucas and Suva.<br />
Table 29: Baseline Tourism Data for 2015<br />
Division<br />
Area<br />
Rooms<br />
Available<br />
Occupancy (%)<br />
Visitor Nights<br />
(%)<br />
Hotel Receipts<br />
(F$ million)<br />
Central Suva 1,591 56.1 9.1 $76.3<br />
Western Nadi 3,513 58.7 35.0 $315.8<br />
Lautoka 833 39.7 3.9 $46.3<br />
Coral Coast 1,937 57.4 28.7 $218.2<br />
Mamanucas 1,424 55.2 19.4 $220.0<br />
Northern Northern Division 739 28.6 2.7 $63.1<br />
Eastern Others 385 19.9 1.3 $17.0<br />
Total 10,422 52.5 100 $956.7<br />
Source: FBOS Quarterly Tables 1 to 11.<br />
Assessment of Disaster Effects on the Tourism Sector (F$120 million)<br />
TC Winston’s track avoided <strong>Fiji</strong>’s most popular and productive tourism regions, but did however cause extensive<br />
damage to the infrastructure, facilities and amenities of at least 75 tourism businesses. The majority of those affected are<br />
accommodation providers, with almost no impact reported by tour operators. Nadi, Suva and the Coral Coast, which<br />
received 72.8 percent of visitors in 2015 (see Table 29), were left relatively unscathed by TC Winston.<br />
In the immediate aftermath of TC Winston, the Tourism Action Group (TAG) 65 implemented a successful strategy based on<br />
lessons learned from previous cyclones. Having quickly established the viability of key locations and properties, the priority<br />
was to minimise negative reporting on TC Winston’s impact on <strong>Fiji</strong>’s (economically critical) tourism sector. International and<br />
regional media in core markets were kept updated through all available communication channels. In addition, Tourism <strong>Fiji</strong><br />
provided messaging to consumers directly through social media.<br />
Flights were reinstated after only two days of cancelled services, and a clear ‘business as normal’ message was pushed<br />
out to core markets, reinforced by discounting some airfares and packages. Furthermore, the ability of the government and<br />
TAG to persuade the Australian Department of Trade and Foreign Affairs and the New Zealand Ministry of Foreign Affairs<br />
and Trade not to issue travel warnings greatly reduced cancellations both immediately after the event and with regards to<br />
future bookings.<br />
Damage to the Tourism Sector (F$76 million)<br />
Across the affected areas, businesses have reported damage to physical assets, equipment and furnishing, without<br />
reporting any significant damage to public tourism infrastructure. Most of the damage has been to exteriors, with interior<br />
damage resulting from the deterioration of buildings during the storm and consequent water damage that has resulted in<br />
the destruction of furnishings and equipment. Significant damage to foliage and landscaping, as well as to coral reefs in the<br />
Vatuira Passage, was also reported. The impact on coral reefs and diving sites used by the tourism industry are detailed<br />
and needs are addressed through the environment section of this PDNA.<br />
64<br />
Provisional Hotel and Tourist Accommodation Statistics - Quarterly Release, June 2nd Quarter, FBOS.<br />
65<br />
The Tourism Action Group is an initiative of partners in the tourism industry urgently activated in the aftermath of TC Winston to reassure<br />
and continue to encourage global travellers to come to <strong>Fiji</strong>. TAG has three key functional arms, including public relations, marketing and<br />
finance.<br />
Tropical Cyclone Winston, February 20, 2016<br />
59
FIJI Post-Disaster Needs Assessment<br />
Table 30: Damage and Losses in the Tourism Sector by Division (F$ million)<br />
Division Damage Losses Total Effects<br />
Central 0.8 0.5 1.3<br />
Eastern 6.6 12.9 19.5<br />
Northern 13.0 19.1 32.1<br />
Western 55.8 11.3 67.1<br />
Total 76.1 43.9 120.0<br />
Source: Estimations by Assessment Team.<br />
Losses to the Tourism Sector (F$44 million)<br />
Approximately F$44 million 66 in losses has been estimated for the tourism sector, with F$40 million attributed to revenue<br />
loss from cancellations and non-fulfillment of future bookings, and F$4 million attributed to additional costs incurred. The<br />
vast majority of revenue losses (F$34 million) are carried by just three exclusive island properties.<br />
The impact on visitor arrivals is estimated to be minimal with a reduction of just over 3,700 visitors during 2016 (around 0.5<br />
percent of arrivals in 2015).<br />
Social Impact of Damage and Losses<br />
Due to the relatively small and localized impact of TC Winston, the impact on employment and incomes is likely to be<br />
minimal compared to some of the other sectors considered in this PDNA (i.e., agriculture). According to the MITT survey,<br />
the majority of affected businesses are partially damaged and intend to continue operating at reduced capacity or reopen<br />
within a couple of months. The handful of businesses that were severely damaged and will remain closed for an extended<br />
period have not shared data on staffing or the social impact for communities with which they have links.<br />
While the men’s share in <strong>Fiji</strong>’s tourism industry is larger than that of women, the sector offers paid employment to a larger<br />
share of women than men; 12.8 percent of women work in the sector, compared to 7.4 percent of men. 67 The economic<br />
performance of the sector particularly in terms of recovery is, therefore, important to women’s social and economic<br />
advancement. While complete data on women’s and men’s employment in the sector are not available, women are usually<br />
employed as housekeepers, receptionists and waitresses. Only one-quarter of managerial and professional positions are<br />
held by women. 68<br />
The employment and livelihoods analysis included in Chapter 2.2 of this PDNA indicates that as a result of TC Winston,<br />
women lost an estimated aggregate personal income of about F$7 million, while men lost almost F$10 million. But while<br />
men have incurred the larger drop in personal income overall, women were likely more affected by the cyclone, since they<br />
comprise a larger proportion of those within the tourism industry who are paid minimum wage. In addition, the reduced<br />
operating capacity and temporary closure of some of the hotels may have harmed women more than men, as women are<br />
likely be the first to lose their jobs when the sector experiences a downturn. During these times, the tourism sector tends<br />
to maintain managerial and technical jobs held by men, while laying off low-skilled women who can be easily replaced.<br />
Tourism also provides an important market for woman-owned micro and small enterprises, such as those selling flowers<br />
for hotels, artisanal products, cosmetics for beauty spas and jewelry. According to the ADB, 69 women outnumber men in<br />
the crafts market (jewelry, wooden crafts and woven mats), which is highly reliant on the tourist market. Women handcraft<br />
groups in Ba in the Western Division have reported that in the aftermath of the cyclone, their daily income from tourists<br />
is F$50 to F$140 a day lower than it was before. 70 Although the reduction in tourist numbers is small, it has had, and will<br />
continue to have, a negative impact on women’s livelihoods until the tourist numbers are restored to pre-cyclone levels.<br />
Recovery and Reconstruction Needs for the Tourism Sector (F$34 million)<br />
Total recovery and reconstruction needs are estimated at F$34 million for the tourism sector, which includes F$29 million<br />
for reconstruction and F$5 million for recovery. While a small number of properties suffered extensive damage and losses,<br />
66<br />
Hotels reported a total loss of F$50 million due to cancellations and loss of future bookings. This has been revised to F$40 million due to<br />
the likelihood that a proportion of visitors will rebook at equivalent properties within <strong>Fiji</strong>.<br />
67<br />
These figures are based on the analysis of the accommodation and food services subsector by the <strong>Fiji</strong> Bureau of Statistics; see “FBOS<br />
Release No. 94: Provisional Annual Paid Employment 2014,” 2015.<br />
68<br />
Asian Development Bank, “<strong>Fiji</strong> Country Gender Assessment,” 2015.<br />
69<br />
Ibid.<br />
70<br />
Figures are based on interviews with 45 members of a women’s handcraft group on April 13, 2016, in Visesei Village, Vuda, Ba. The<br />
interviews were conducted by the Ministry of Women, Children and Poverty Alleviation along with UN Women, the International Labour<br />
Organization and the United Nations Development Programme.<br />
60 Tropical Cyclone Winston, February 20, 2016
FIJI Post-Disaster Needs Assessment<br />
most are insured and the overall economic effects of TC Winston to the tourism sector will be muted. Prior to the cyclone,<br />
visitor numbers were predicted to increase in 2016 and the estimated reduction in visitor numbers by 3,700 represents only<br />
a 0.5 percent drop in arrivals, which will mainly be felt in the second quarter, after which the majority of affected businesses<br />
are expected to be fully operational again with visitor numbers beginning to surpass 2015 arrivals.<br />
Of the 75 businesses reporting to MITT, 49 have either confirmed they hold insurance or have not verified their insurance<br />
status. 71 The value of insurance claims received by insurance companies is approximately F$85 million covering both<br />
damage and business interruption. These claims have yet to be assessed, but typically about 10 percent of claims are<br />
rejected and the settlement process can take 12 months or longer for all claims assuming no litigation. Furthermore, the<br />
insured must pay an ‘excess,’ which is roughly 20 percent of the value of the claims. An estimated F$61 million (assuming<br />
90 percent of claims are settled) to F$68 million (assuming all F$85 million is settled) will be paid out and the insured would<br />
pay an excess of F$15 to F$17 million. In addition, 24 businesses have stated that they lack insurance, representing<br />
damage and losses of F$12 million. 72 This funding gap of up to F$29 million is the minimum to which additional funding<br />
must be added for BBB (see Table 31).<br />
Given the large number of uninsured smaller tourism businesses, discussions will be needed with the tourism sector to<br />
establish ways to support the sector in accessing appropriate and affordable risk management products. Import duty<br />
waivers could also be considered to assist in reducing the rebuilding cost. Maintaining <strong>Fiji</strong>’s reputation as a safe tourist<br />
destination, even during cyclone season, is also important.<br />
Table 31: Damage and Estimated Rebuilding Cost for the Tourism Sector by Division (F$ million)<br />
Division Damage Cost to rebuild, incorporating the principles of BBB<br />
Central 0.8 0.9<br />
Eastern 6.6 7.2<br />
Northern 13.0 14.3<br />
Western 55.8 61.4<br />
Total 76.2 83.8<br />
Source: Estimations by Assessment Team.<br />
Table 32: Total Recovery and Reconstruction Needs for the Tourism Sector (F$ million)<br />
Recovery Reconstruction Resilience Total<br />
Marketing – immediate info campaign 1.0 1.0<br />
Marketing – destination confidence campaign 2.0 2.0<br />
Reconstruction (F$83.9 million, less F$54.8 million insurance) 29.0 29.0<br />
Import duty waivers for reconstruction materials 2.0 2.0<br />
Short-term technical assistance for review of tourism sector<br />
insurance products<br />
Total 5.0 29.0 34.0<br />
Source: Estimations by Assessment Team.<br />
Note: A detailed breakdown of recovery needs by sector is included in Annex 2.<br />
3.1.4 Mining Sector<br />
Summary<br />
Although <strong>Fiji</strong>’s mining and quarry industry produces gold, silver, quarrying and groundwater resources, the assessment and<br />
analysis undertaken here deal mainly with gold production, which is dominated by the Vatukoula Gold Mines (VGM). Mining<br />
is an integral part of <strong>Fiji</strong>’s economy, with gold representing one of the country’s largest exports. On average, the mining<br />
and quarry sector has accounted for about 1.2 percent of GDP annually since 2011, although the sector experienced a<br />
decline in performance in 2012 and 2013 due to underground flooding and low gold ore production. The VGM is one of the<br />
country’s largest industries and accounts for 3.6 percent of total employment in the Western Division.<br />
0.0<br />
71<br />
This corresponds with 49 claims received by local insurance companies (at the time of reporting).<br />
72<br />
It was not possible to establish insurance coverage of several hotels.<br />
Tropical Cyclone Winston, February 20, 2016<br />
61
FIJI Post-Disaster Needs Assessment<br />
While other mining prospecting sites exist around the country, the VGM operates within three special mining leases that<br />
cover a total area of 1,255 ha. VGM also has the right to explore areas outside the current mining leases via a special<br />
lease that covers over 19,000 ha of the surrounding Tavua volcano. Total damage to the sector following TC Winston is<br />
estimated at F$11.5 million, and economic losses are estimated at F$20.0 million. Hence, the total effects of TC Winston on<br />
the mining and quarry sector are estimated at F$31.5 million. Total recovery needs for the sector total F$11 million, which<br />
includes F$5 million in reconstruction needs that can, however, be met by insurance coverage for VGM. About F$6 million<br />
is needed to recover lost revenues by VGM.<br />
The industry must focus on an immediate response to urgent needs and must also take steps to achieve and maintain<br />
production at a sustainable level. The BBB approach will be incorporated into the medium- and long-term recovery and<br />
reconstruction activities to ensure robust industry growth.<br />
Mining Sector Background<br />
Eight mining leases are currently monitored in <strong>Fiji</strong>, and 78 exploratory licenses have been issued. Mining activities are<br />
expected to increase in the near future. Measured in terms of revenue generated through the export of gold and other<br />
minerals, VGM dominates the mining and quarry sector. Gold shipped for the month of February 2016 (2,114 oz) was 46<br />
percent lower than for January 2016 (3,913 oz). With the price of gold at US$1,097.40 per ounce, this equals a production<br />
loss of F$3.7 million.<br />
Assessment of Disaster Effects on the Mining Sector (F$32 million)<br />
Damage and production losses in the mining sector were predominantly sustained by VGM, both at the underground and<br />
surface mining facilities.<br />
Table 33 shows the total value of damage and production losses in the mining sector. Figures for total estimated damage<br />
were provided by the Inspectorate Unit and the Environmental Unit of the Mining Division within the Department of Mineral<br />
Resources based on their onsite assessment following TC Winston.<br />
Table 33: Quantification of Damage and Losses in the Mining Sector (F$ million)<br />
Damage Losses Total Private Public<br />
Mining Industry (Vatukoula Gold Mines, Ltd.) 11.5 20.0 31.5 100 0<br />
Source: Estimation by Assessment Team.<br />
Note: Total estimated loss was based on the assumption that the average gold shipped per week is 1,100 oz at the price of US$1,097.40.<br />
Damage to the Mining Sector (F$12 million)<br />
TC Winston caused significant damage to buildings, infrastructure and other assets at VGM. Most of the damage to the<br />
mining and quarry sector involved structural damage to buildings (factory, office and staff quarters), furniture (in offices and<br />
staff quarters), communication and technology infrastructure, and machinery. Underground mining areas also suffered<br />
extensive damage due to flooding. Overall, the surface facilities were more affected than the underground facilities. Table<br />
34 shows the damage to key assets within the mining industry.<br />
Table 34: Damage to Key Assets in the Mining Sector<br />
Damage (F$ million)<br />
Underground Assets Surface Assets Total Damage<br />
Buildings 0 4.8 4.8<br />
Mining area 2.6 0 2.6<br />
Infrastructure 0.3 0.5 0.8<br />
Assets 2.4 1.0 3.4<br />
Total 5.3 6.3 11.6<br />
Source: Estimations by Assessment Team.<br />
62 Tropical Cyclone Winston, February 20, 2016
FIJI Post-Disaster Needs Assessment<br />
Losses to the Mining Sector (F$20 million)<br />
Losses are primarily attributable to loss of earnings, higher operational costs, cleanup costs and lower productivity, which<br />
resulted from flooding at the underground mine and led to a decline in gold shipped. Total gold shipped in February 2016,<br />
the month of the cyclone, was 2,114 oz, which was 1,799 oz less than the January shipment. Table 35 shows the mining<br />
industry’s total loss (including gold shipped and earnings) due to low production.<br />
Table 35: Losses in the Mining Sector<br />
February–March April–June Total Effects<br />
Loss in Gold Shipped (oz) 1,522 6,874 8,396<br />
Loss in Earnings (F$ million) 3.7 16.3 20.0<br />
Source: Estimations by Assessment Team.<br />
Note: Some of the costs (losses) to the sector could not be determined at this early stage of assessment. The average gold shipped per week<br />
is 1,100 oz. Calculations assume that by July 2016, VGM will be back at full capacity and that the average gold shipped per week is 1,100 oz at<br />
the price of US$1,097.40.<br />
Social Impact of Damage and Losses<br />
Despite normal operations at VGM after the cyclone, sector operations were affected by the poor attendance of workers,<br />
the majority of whom were affected by the devastating cyclone in some way (such as damage to their homes).<br />
Much of the damage done to buildings posed a risk to the environment. For example, live electrical wires were exposed to<br />
rain and sun, and the chemical storage facility was damaged, potentially exposing staff to hazardous chemicals. However,<br />
the staff acted quickly to address and mitigate the risks. Structural engineers working within the sector were deployed to<br />
the site to undertake the assessment, and the findings formed the basis for the rehabilitation and maintenance works to<br />
be undertaken.<br />
Recovery and Reconstruction Needs for the Mining Sector (F$11 million)<br />
Total recovery and reconstruction needs for the mining sector (that is, for VGM) are estimated at F$11 million. Approximately<br />
F$6 million is needed to cover costs of operating the mine from February to July 2016, when the industry is expected to be<br />
back at full capacity, and includes costs for repairing minor damage, paying wages, etc., without full revenue while there are<br />
no gold sales. The remaining F$5 million is required for VGM’s first insurance deductible of F$5 million. The assumption is<br />
that the insurance company will agree to pay 100 percent of the claim for F$11.5 million (total damage on physical assets).<br />
Table 36 provides the breakdown of recovery needs that must be met to return the industry to full capacity.<br />
Table 36: Total Recovery and Reconstruction Needs for the Mining Sector (F$ million)<br />
Recovery of lost revenue by increasing gold<br />
production (VGM)<br />
Maintenance/repair of buildings and<br />
infrastructure (Insurance excess)<br />
Recovery Reconstruction Resilience Total<br />
6.0 6.0<br />
5.0 5.0<br />
Total 6.0 5.0 11.0<br />
Source: Estimations by Assessment Team.<br />
Note: A detailed breakdown of recovery needs by sector is included in Annex 2.<br />
VGM is expected to fund the majority of reconstruction requirements. However, more funding may be required for additional<br />
risk management mechanisms and insurance arrangements, which will take into account cyclone risks and support the<br />
industry in BBB. Maintaining well-skilled employees for construction activities is also important.<br />
Tropical Cyclone Winston, February 20, 2016<br />
63
FIJI Post-Disaster Needs Assessment<br />
Children inside a damaged home in Malake Landing,<br />
Ra, Viti Levu<br />
Source: Vlad Sokhin/World Bank<br />
3.2 Social Sectors<br />
3.2.1 Education<br />
Summary<br />
TC Winston severely damaged education facilities across <strong>Fiji</strong>, with damage and losses to the education sector totaling<br />
F$77 million.<br />
495 schools were affected with damage to classrooms, staff housing, furniture, educational resources and equipment. The<br />
worst affected area was the Western Division, which sustained over 50 percent of total damage and where 61 schools were<br />
severely damaged. Private schools and higher education institutions reported no cyclone damage as they are all located in<br />
urban areas that were not seriously impacted by TC Winston.<br />
The majority of schools reopened after five to 10 days once debris was cleared and minor repairs were made. Tents were<br />
provided as temporary classrooms for schools with significant damage. Only three schools remain closed at the time of this<br />
PDNA assessment and they are expected<br />
to be rebuilt by the beginning of the 2017<br />
19%<br />
school year. The 859 students and the<br />
teachers from these three schools have<br />
been relocated to neighbouring schools.<br />
Western<br />
Many school staff and students lost their<br />
homes and belongings and entire school<br />
communities have been traumatized by<br />
the cyclone experience. In spite of this,<br />
communities and staff worked together to<br />
clear debris and repair classrooms so that<br />
school could recommence as quickly as<br />
possible.<br />
Northern<br />
Eastern<br />
19%<br />
Central<br />
11%<br />
Figure 22: Share of Damage and Losses in the Education Sector by Division<br />
Source: Estimations by Assessment Team.<br />
64 Tropical Cyclone Winston, February 20, 2016
FIJI Post-Disaster Needs Assessment<br />
Qalivakabau District School, Eastern Division<br />
Source: Ministry of Education<br />
Education Sector Background<br />
The education system in <strong>Fiji</strong> is administered by the Ministry of Education under the Education Act 1978. There are over<br />
1,700 schools in <strong>Fiji</strong>: 715 early childhood education facilities (42 percent), 731 primary schools (43 percent), 177 secondary<br />
schools (10 percent), 75 Technical and Vocational Education Training (TVET) institutions (4 percent) and 17 special education<br />
schools (0.9 percent). 97 percent of the schools are faith based and/or community owned and are supported through<br />
government grants. The government owns and manages 12 schools, including twelve large secondary schools. The<br />
Ministry of Education provides teachers and curriculum for all faith-based, community and government schools. Private<br />
schools make up less than 2 percent of the total schools in <strong>Fiji</strong>.<br />
Table 37: Number of Schools by Division (as of 2014)<br />
Education Level Central Western Northern Eastern Total<br />
Early Childhood Education<br />
(attached and standalone)<br />
Percent of<br />
Total School<br />
Facilities<br />
(%)<br />
252 267 134 62 715 42<br />
Primary 204 249 163 115 731 43<br />
Secondary 68 58 38 13 177 10<br />
Special Education 7 7 2 1 17 1<br />
Technical Vocation and Training 24 29 14 8 75 4<br />
Total 555 610 351 199 1715 100<br />
Source: MOE.<br />
The government’s commitment towards ensuring that all <strong>Fiji</strong>ans have access to basic education at all levels remains a<br />
priority. In 2014, <strong>Fiji</strong> achieved universal access to primary education (a Millennium Development Goal target) through<br />
various government-implemented policies and initiatives. The Ministry of Education employs 10,411 teachers.<br />
In 2015, the Ministry of Education was allocated a budget of F$398 million to provide quality education to all <strong>Fiji</strong>ans.<br />
Funding was included for grant assistance for free tuition, bus services and textbooks. Upgrading existing schools and<br />
building new facilities are also government priorities.<br />
Tropical Cyclone Winston, February 20, 2016<br />
65
FIJI Post-Disaster Needs Assessment<br />
Assessment of Disaster Effects on the Education Sector (F$77 million)<br />
A total of 495 schools was affected by TC Winston with damage to classrooms, science laboratories, libraries, staff rooms,<br />
ablution blocks, teacher housing and the gardens attached to boarding schools.<br />
Damage to the Education Sector (F$70 million)<br />
The education sector suffered damage valued at F$69.2 million, which included damage to buildings, furniture and<br />
equipment, and education resources.<br />
172 schools suffered severe structural damage, the majority of which were primary schools, which sustained damage<br />
valued between F$0.08 to F$0.79 million per school. Five secondary schools sustained severe damage valued at over F$1<br />
million per school with the Queen Victoria School in Tailevu Province requiring complete reconstruction.<br />
Losses to the Education Sector (F$7 million)<br />
The education sector suffered losses valued at F$7.4 million, including the costs of temporary learning spaces, classroom<br />
cleaning, debris removal, transporting students to alternative schools, and counselors to provide psychosocial support to<br />
staff and students.<br />
Boarding schools also sustained losses to their school gardens, which produce staple crops and vegetables to feed<br />
students. In the worst instances, cassava gardens were completely destroyed and, after replanting, will not be ready for<br />
harvesting for another eight to 12 months.<br />
Total damage and losses in the education sector in each of the four divisions are described in Table 38.<br />
Table 38: Damage and Losses in the Education Sector by Division (F$ million)<br />
Division Damage Losses Total Effects Public (%) Private (%)<br />
Central 13.0 1.4 14.4 100 0<br />
Eastern 13.6 0.7 14.4 100 0<br />
Northern 7.7 1.0 8.7 100 0<br />
Western 34.8 4.3 39.1 100 0<br />
Total 69.2 7.4 76.6 100 0<br />
Source: Estimations by Assessment Team.<br />
Social Impact of Damage and Losses<br />
Although most children have returned to school, the impact of TC Winston on the affected population will be significant.<br />
Forty-three percent of <strong>Fiji</strong>’s students are enrolled in schools that sustained cyclone damage. Following TC Winston, the<br />
Ministry of Education, local communities and development partners, such as the UN Children’s Fund (UNICEF), and the<br />
Governments of Australia and New Zealand worked together to ensure the distribution of temporary learning facilities to<br />
damaged schools. Textbooks and other learning resources were also provided for affected students.<br />
Increased work burdens due to the disaster could have negative consequences for school enrolment and child labour.<br />
In particular, concern was expressed that older boys are likely to be absent from school as they assist their families with<br />
rebuilding homes and re-establishing livelihoods. Before TC Winston, 9 percent of children were not in school because they<br />
were performing household work 73 in families unable to afford school, and data indicate that, in the past, nearly one-third<br />
of children who do not attend school (31.9 percent) stayed home because they could not afford it. 74 These numbers could<br />
potentially increase as more hands are needed to support domestic work, agricultural work and other livelihood activities.<br />
The schooling of girls, in particular, could be affected, given that household activities tend to be performed by females,<br />
beginning as young as six years old. 75<br />
According to reports from the Child Protection Sub-Cluster (part of the Education Cluster), teachers have seen signs of<br />
psychological distress in children following the cyclone, and there is a risk that caregivers will resort to negative coping<br />
behaviours, which will increase cases of child abuse and neglect. Communities, teachers and students have been<br />
traumatized by the experience and many have lost all personal belongings and their homes. Counseling has been provided<br />
to 2,341 students and 279 teachers from 91 schools across the country at a cost of F$70,000, but the quality of teaching<br />
73<br />
FBOS, “The 2010–11 Employment and Unemployment Survey: Preliminary Findings,” 2012.<br />
74<br />
Ibid.<br />
75<br />
FBOS, “<strong>Fiji</strong> Women and Men at Work and Leisure: Final Report,” 2013.<br />
66 Tropical Cyclone Winston, February 20, 2016
FIJI Post-Disaster Needs Assessment<br />
and learning may be negatively impacted throughout the recovery period. Given what the population experienced during<br />
TC Winston and recent floods, and given how common tropical depressions are in the region, children’s mental health<br />
should be monitored. School programmes should, therefore, continue to provide psychosocial support to children and<br />
caregivers in order to reduce the psychological distress brought about by TC Winston and other more localized disaster<br />
events.<br />
The school year is 205 days and damaged public schools were closed for between five and 10 days to repair and clean<br />
classrooms. The Ministry of Education has reduced each of the term vacations by one week to make up for lost teaching<br />
and learning time. In some schools, teachers are offering extra classes before and after school to allow students to catch<br />
up. The greatest impact to learning may be felt by secondary students who have lost access to science and computer<br />
laboratories. These facilities are costly to rebuild and teachers will struggle to provide adequate lessons while in temporary<br />
classrooms.<br />
Recovery and Reconstruction Needs for the Education Sector (F$386 million)<br />
Recovery and reconstruction costs are valued at F$385.9 million, which includes: rebuilding completely damaged schools;<br />
repairing and upgrading partially damaged schools; and replacing damaged furniture, equipment, and teaching and<br />
learning resources.<br />
Table 39 provides a breakdown of the recovery needs for the following five years.<br />
Table 39: Total Recovery and Reconstruction Needs for the Education Sector (F$ million)<br />
Travel costs associated with<br />
counselling<br />
Recovery Reconstruction Resilience Total<br />
0.007 0.007<br />
Replacement of education materials 8.3 8.3<br />
Design construction and project<br />
management<br />
348.9 348.9<br />
Furniture and equipment 28.7 28.7<br />
Total 385.9 385.9<br />
Source: Estimations by Assessment Team.<br />
Note: A detailed breakdown of recovery needs by sector is included in Annex 2.<br />
Of the 495 schools impacted by the cyclone, 323 (65 percent) require repairs assessed at less than F$0.8 million to ensure<br />
they are at a safe standard for use. The Ministry of Education has instructed these schools to use their school building<br />
grants to undertake the repairs, which will cost, in total, F$9.5 million. Priorities will be set for rebuilding the remaining 172<br />
schools that have significant structural damage, with some needing to be completely rebuilt.<br />
The <strong>Fiji</strong> Institute of Engineers (FIE) has undertaken assessments of the structurally damaged schools and prepared cost<br />
estimates for their reconstruction. The extent of damage to school and staff housing highlights issues with building<br />
standards and maintenance. The FIE report identifies factors contributing to damage as: (i) lack of periodic maintenance<br />
and structural upgrades; (ii) age of buildings; and (iii) poor construction and workmanship. The most common failures with<br />
education facilities related to roof cladding and framing. The concrete block structures generally performed better than the<br />
timber ones, which often failed from the ground up. The worst affected schools were those in vulnerable locations, such<br />
those as close to the coast or in other very exposed positions.<br />
Reconstruction activities will adhere to the BBB principles. The FIE assessment provides intermediate costing to rebuild<br />
schools to a “safe school” standard and long-term costing to rebuild to a BBB standard. Adhering to BBB principles will:<br />
(i) ensure buildings are designed to resist future disaster damage, including from cyclones, earthquakes, tsunamis, floods<br />
and landslides; (ii) meet the needs of a first class education curriculum; (iii) ensure accessibility to people with disabilities;<br />
and (iv) include adequate WASH (water, sanitation and hygiene) facilities. Before major reconstruction begins, the Ministry<br />
of Education will consider relocating the most vulnerable schools and rationalizing school facilities. Further consultations will<br />
be undertaken with government-line ministries on the relocation of schools affected by climate change.<br />
A summary of the intermediate and long-term recovery costs for the 495 schools in the four divisions are in Table 40.<br />
Tropical Cyclone Winston, February 20, 2016<br />
67
FIJI Post-Disaster Needs Assessment<br />
Table 40: Intermediate and Long-Term Reconstruction Costs for the Education Sector (F$ million)<br />
Division Intermediate Reconstruction Costs Long-Term Reconstruction Costs Total<br />
Central 18.9 50.0 68.9<br />
Eastern 20.1 63.7 83.8<br />
Northern 10.6 16.0 26.6<br />
Western 51.3 155.3 206.6<br />
Total 101.0 285.0 385.9<br />
Source: Estimations by Assessment Team.<br />
Adopt a School<br />
As part of the recovery strategy, the government launched the Adopt a School initiative, which will support the reconstruction<br />
of around 300 schools. The associated website (www.adoptaschool.gov.fj) provides details of damage and costs for each<br />
facility, and allows donors to contribute to the rebuilding and repair of a particular school. The Australian Government,<br />
through the Achieving Quality Education Program, has committed to fund the recovery of 26 primary schools located in<br />
rural areas across <strong>Fiji</strong>. Likewise, the Government of New Zealand has adopted schools on the Island of Vanua Balavu, while<br />
the Indonesian Government opted to assist the reconstruction works for the Queen Victoria School in Tailevu Province. The<br />
Reach for the Future Foundation has also announced it will support six schools across the country.<br />
3.2.2 Health<br />
Summary<br />
Total damage and losses to the health sector as a result of TC Winston are estimated at F$13.9 million. The sector<br />
sustained significant damage and losses to facilities in the Central Division (24.3 percent of total damage), Western Division<br />
(23.4 percent of total damage) and Eastern Division (22.7 percent of total damage), with minor incidence of damage<br />
experienced in the Northern Division (5 percent of total damage). Total damage caused by TC Winston to the health sector<br />
is estimated to be approximately F$7.7 million (see Figure 23), with notable damage to infrastructure facilities, which is<br />
inclusive of damage associated with water, power and telecommunications. Health sector losses are approximately F$6.2<br />
million inclusive of funds re-diverted for response operations, additional drugs and supplies, additional service delivery<br />
costs and psychosocial support. An estimated F$30.9 million will be required for recovery and reconstruction needs and<br />
approximately F$59.3 million to improve the health sector’s resilience to climate change and natural disasters in the longer<br />
term.<br />
F$ million<br />
16.0<br />
14.0<br />
12.0<br />
10.0<br />
8.0<br />
6.0<br />
4.0<br />
2.5<br />
0.0<br />
Figure 23: Total Damage and Losses in the Health Sector<br />
Source: Estimations by Assessment Team.<br />
Health Sector Background<br />
Damage Losses Total Effects<br />
The Ministry of Health and Medical Services (MoHMS) is responsible for providing clinical and preventative healthcare<br />
services. Clinical services are mainly provided at the hospitals and some health centres, while preventative healthcare<br />
services are through preventive care programmes, hospitals, health centres and nursing stations. Healthcare services are<br />
implemented through a decentralized health system that caters to integrated health care at the primary, secondary and<br />
tertiary care levels. Administration and management of human resources, finance, and drugs and medical supplies are<br />
centralized.<br />
The MoHMS provides health services to the entire population of <strong>Fiji</strong> through hospitals, health centres and nursing stations.<br />
Medical Superintendents are responsible for the clinical services in the divisional and specialized hospitals and report to<br />
the Deputy Secretary of Hospital Services. Sub-divisional hospitals, health centres and nursing stations are managed by<br />
Divisional Medical Officers, who report directly to the Deputy Secretary of Public Health.<br />
68 Tropical Cyclone Winston, February 20, 2016
FIJI Post-Disaster Needs Assessment<br />
Eighteen sub-divisional hospitals also provide primary and secondary level clinical and preventive health services within a<br />
designated medical area, which also has health centres and nursing stations within each health facility providing primary<br />
healthcare services.<br />
Three hospitals provide specialized health services, namely St. Giles for psychiatry, P.J. Twomey Hospital for tuberculosis<br />
and leprosy, and the Tamavua Rehabilitation Centre for restoring good health through therapy. The private sector provision<br />
of healthcare services consists mainly of outpatient services through general practitioners, inpatient services primarily<br />
through two private hospitals, and the sale of medicine by retail pharmacies. The health sector assessment in this chapter<br />
does not include private sector data.<br />
There are approximately 214 health facilities in <strong>Fiji</strong> (see Table 41) comprising two specialized hospitals/national referral<br />
centres, three divisional hospitals, 19 sub-divisional hospitals (Level 1-2 76 ), 80 health centres (Level A-C 77 ), 107 nursing<br />
stations and three private hospitals distributed across all four divisions. Sixty-three health facilities are in the Western<br />
Division (the highest of all divisions), followed by 56 in the Eastern Division, 51 in the Central Division and 44 in the Northern<br />
Division. About 5,862 staff work in the MoHMS at all levels, including administrative and service delivery.<br />
Table 41: Health Facilities in <strong>Fiji</strong><br />
Health Facility Central Eastern Western Northern Total<br />
National Referral Centre 2 0 0 0 2<br />
Divisional Hospital 1 0 1 1 3<br />
Sub-Divisional Hospital (Level 1) 0 0 3 1 4<br />
Sub-Divisional Hospital (Level 2) 5 5 3 2 15<br />
Health Centre (Level A) 7 0 4 1 12<br />
Health Centre (Level B) 2 1 6 3 12<br />
Health Centre (Level C) 11 14 17 14 56<br />
Nursing Stations 22 36 28 21 107<br />
Old People’s Home 1 0 1 1 3<br />
Total 51 56 63 44 214<br />
Source: MoHMS.<br />
Assessment of Disaster Effects on the Health Sector (F$14 million)<br />
To measure the impacts of TC Winston, assessments to health facilities were categorized into the following areas to<br />
determine:<br />
<br />
<br />
<br />
and<br />
<br />
costs.<br />
Damage to the Health Sector (F$8 million)<br />
Total damage to the health sector was estimated at approximately F$7.7 million (see Table 42). Eighty-eight health facilities<br />
sustained some level of damage due to TC Winston, with 40 of them prioritized by the government for immediate repair<br />
works. Infrastructure damage costs include damage related to water, power and telecommunications. Damage estimates<br />
per facility level were conducted by healthcare workers at each of the respective health facilities, with the exception of three<br />
sites (Koro, Nabasovi and Nacamaki), which were assessed by the Ministry of Infrastructure and Transport, and eight sites,<br />
which were assessed by the FIE. 78 Total infrastructure damage totaled F$6.9 million, 79 with the Kese, Nasau, Nabasovi,<br />
Waimaro, Nanukuloa and Lomaloma health centres badly affected.<br />
76<br />
Level 1 sub-divisional hospitals cater to >35,000 people, are staffed by general medical practitioners, midwives, nurses and allied health<br />
staff, and operate 24/7. Level 2 cater to 15,000-35,000 population, but share resources with some Level C or B health centres.<br />
77<br />
Level A health centres are located mainly in urban areas with populations of >35,000, staff medical doctors or nurses, and opening hours<br />
from 8:00 am to 4:30 pm. Level B heath centres cater to populations of 10,000-20,000, with two nurses, including a nurse practitioner, and<br />
may have a doctor. Level C health centres cater to populations of 4,000-9,900, have nurses and may have a doctor, and share resources<br />
with Level 2 sub-divisional hospitals.<br />
78<br />
The FIE conducted assessments of government priority health facilities; however, only eight reports were made available to the sector<br />
team to verify and finalize damage and loss data (Namarai, Nanukuloa, Ba Health Centre, Balevu, Dawasamu, Nadrau, RKS and Londoni).<br />
79<br />
Due to the extensive damage, all the drugs and equipment at these facilities are assumed to have been destroyed.<br />
Tropical Cyclone Winston, February 20, 2016<br />
69
FIJI Post-Disaster Needs Assessment<br />
Losses to the Health Sector (F$6 million)<br />
Total losses for the health sector were estimated to be approximately F$6.2 million (see Table 42). Losses incurred post-TC<br />
Winston include psychosocial support and psychological first aid provided by development partners, NGOs and MoHMS<br />
to affected population. Retired nurses were reengaged to assist medical teams that provided immediate medical care to<br />
affected communities in the aftermath of TC Winston. Losses include: costs associated with additional outreach activities<br />
conducted following Winston; and increased operational costs associated with such activities that were calculated as<br />
increased expenditure by the health sector during the disaster emergency period. 80<br />
Approximately F$3.6 million was used by MoHMS to purchase additional drugs and supplies and F$0.3 million for additional<br />
service delivery costs. Approximately F$0.7 million was used by the Ministry from its own budget for operational expenses<br />
related to TC Winston.<br />
Table 42: Damage and Losses to the Health Sector by Division (F$ million)<br />
Damage Losses Total Effects<br />
Central 2.6 0.8 3.4<br />
Western 2.1 1.2 3.3<br />
Northern 0.4 0.3 0.7<br />
Eastern 2.6 0.5 3.1<br />
Headquarters – MoHMS 0.0 0.1 0.1<br />
National level 0.0 3.4 3.4<br />
Total 7.7 6.3 14.0<br />
Source: Estimations by Assessment Team.<br />
Social Impact of Damage and Losses<br />
The disaster has affected economic and physical access to food. The extensive destruction of agricultural produce could<br />
have serious repercussions for food security and nutrition in both the short and long term. Because some of the nutritional<br />
impacts may not become evident until the harvest season begins, the government and development partners may be<br />
prompted to end food rations prematurely. The assessment of fisheries indicates that fisheries resources may take more<br />
than 10 years to recover. This could have serious consequences for nutrition, which is already suffering from the population’s<br />
increased preference for cheaper but less nutritious foods, such as instant or tinned foods.<br />
Malnutrition usually comes a few months after a disaster has occurred and sometimes even a year later. As families struggle<br />
to meet competing basic needs on reduced incomes, some of their coping mechanisms may include reducing the amount<br />
and nutritional quality of the food they eat. A focus on restoring homes and livelihoods without a focus on maintaining<br />
proper nutritional levels could, therefore, come at the cost of the health of children and pregnant or lactating women. While<br />
some households are actually reporting temporary increases in food intake because of food rations being distributed by<br />
the government, NGOs and donor partners, households in remote areas (such as Yasawasa and Burewaki villages in the<br />
Western and Eastern Divisions, respectively) are already facing food challenges. In Burewaki, women reported that they<br />
are only eating twice a day because they lack sufficient food. Furthermore, MoHMS is already recording an increase in<br />
malnutrition among children, including on Koro Island. 81 Sustained surveillance of nutrition status among children, pregnant<br />
women and lactating mothers is essential. Food supplements (through programmes, such as the Expanded Food Voucher<br />
Programme for pregnant women in rural areas) should be provided to pregnant and lactating women in the most affected<br />
districts to reduce malnutrition and anaemia, while targeted nutrition programmes for children in areas already reporting<br />
malnutrition cases should be increased and scaled up.<br />
Teenage pregnancy is a growing sexual and reproductive health issue in <strong>Fiji</strong>. 82 Evidence from the 2012 floods suggests that<br />
women and girls who lacked access to food were offering sex in exchange for food as a coping mechanism. Anecdotal<br />
reports suggest that exchanges of this type are already happening in some parts of <strong>Fiji</strong>. 83 Reproductive health services and<br />
outreach by the government and NGOs should, therefore, be strengthened to provide critical services, including maternal<br />
health/family planning, assistance in responding to sexual violence, and adolescent sexual reproductive health services<br />
and information.<br />
80<br />
The reported figures only represent services delivered through the public sector. No data are available for the impact of TC Winston on<br />
health services through the private sector, as no requirements exist for private services to report to MoHMS.<br />
81<br />
Screening has identified 80 cases of moderate acute malnutrition: 33 in Koro, 17 in Taveuni and the rest in other affected areas. It has also<br />
identified 28 cases of severe acute malnutrition: 7 in Koro and 9 from Taveuni. Thus, most of the cases detected so far were from Koro<br />
and Taveuni.<br />
82<br />
ADB, “<strong>Fiji</strong> Country Gender Assessment,” 2015.<br />
83<br />
The inference is based on the Gender Based Violence Subcluster Advocacy Note, “Gender-Based Violence in the Aftermath of the <strong>Fiji</strong><br />
Tropical Cyclone Winston.”<br />
70 Tropical Cyclone Winston, February 20, 2016
FIJI Post-Disaster Needs Assessment<br />
Surveillance of the mental health of affected communities that lack access social workers is also needed. Government<br />
and civil society collaboration with and support to churches, which often serve as a spiritual and psychosocial support to<br />
community members, may be required. Efforts should also be made to provide confidential counseling for men, who may<br />
not seek psychosocial support due to stereotypical ideals of masculinity.<br />
Recovery and Reconstruction Needs for the Health Sector (F$31 million)<br />
In the aftermath of TC Winston, total recovery needs of the health sector are estimated at F$30.9 million in order to ensure<br />
that health services are fully operational and able to meet the health care requirements of <strong>Fiji</strong>ans.<br />
Total recovery needs are estimated at F$12.1 million. In terms of reconstruction, infrastructure and equipment are the major<br />
needs, and will cost approximately F$18.8 million (see Table 43). Forty health facilities have been prioritized as requiring<br />
immediate repairs to damaged structures by the MoHMS. Of these, 24 are scheduled for repairs and maintenance works<br />
during the next few months, while repair works for the remaining 16 facilities will be carried out in 2017. Ten health facilities<br />
affected by TC Winston require immediate relocation because of disaster and climate change threats. Procurement of nonmedical<br />
equipment (generators) is needed for affected facilities earmarked for relocation, and repairs will also be needed for<br />
affected non-medical equipment (solar panels, generators, water pumps, etc.) to replace damaged items.<br />
Table 43: Recovery and Reconstruction Needs for the Health Sector (F$ million)<br />
Recovery Reconstruction Resilience Total<br />
Repairs and maintenance 0.9 0.9<br />
Rehabilitation of facilities 0.9 0.9<br />
Reconstruction of facilities 3.6 3.6<br />
Relocation of medical facilities 11.3 11.3<br />
Procurement of non-medical equipment 1.0 1.0<br />
Procurement and repairs of non-medical<br />
equipment<br />
Replacement for damaged drugs and<br />
supplies<br />
0.4 0.4<br />
0.1 0.1<br />
Medical equipment 0.3 0.3<br />
Cold Chain equipment 0.3 0.3<br />
Drugs and supplies 5.0 5.0<br />
Psychosocial support 1.4 1.4<br />
Additional service delivery costs 4.8 4.8<br />
Operational costs 0.9 0.9<br />
Total 12.1 18.8 30.9<br />
Source: Estimations by Assessment Team.<br />
To address the shortage of medical officers, short-term contracts (one to three month contracts) will continue to be offered<br />
to retired nurses immediately following natural disasters to provide support and medical care for those affected. Moreover,<br />
to strengthen PDNAs, the MoHMS will have to ensure reliable estimates of damage are conducted/collated using one of<br />
two options: (i) a panel of engineers via the Construction Implementation Unit (CIU) within the Ministry of Finance to assess<br />
all damage; and (ii) training of staff on using a standard assessment methodology (damage and loss), including basic<br />
engineering assessment tools.<br />
Over the longer term, further to the needs listed in Table 43, an estimated F$45.9 million will be required to increase the<br />
health sector’s resilience to climate change and natural disasters. This includes: retrofitting 133 health facilities, BBB and<br />
ensuring they are cyclone proof (cost F$20 million); and immediately relocating 23 health facilities because of disaster and<br />
climate change threats (cost F$25.9 million). Partnerships with the private sector, NGOs, and bilateral/multilateral and<br />
development partners will facilitate future investment in disaster risk reduction (DRR) measures for the health sector.<br />
Tropical Cyclone Winston, February 20, 2016<br />
71
FIJI Post-Disaster Needs Assessment<br />
Completely destroyed home, Kings Road near Ba town, Viti Levu<br />
Source: Vlad Sokhin/World Bank<br />
3.2.3 Housing<br />
Summary<br />
Prior to the havoc wreaked by TC Winston, <strong>Fiji</strong> was a relatively well-housed nation in terms of number, size and quality<br />
of its housing stock albeit housing conditions lack uniformity across all areas. Around 57 percent of houses consist of<br />
reasonably well constructed timber frames with either wood or tin iron cladding, while a further 40 percent are made of<br />
concrete/masonry construction. Over the years, the use of traditional bure housing has given way to concrete and fixed<br />
timber frame construction, which lends itself to easier fitting of plumbing and electricity supplies. The median floor area of<br />
<strong>Fiji</strong>’s houses are large, on the order of 80m 2 (concrete) and 60m 2 (timber frame), reflecting a mature housing stock that has<br />
been incrementally consolidated by homeowners over a number of years.<br />
TC Winston destroyed 7.5 percent of the total housing stock and caused major damage to a further 6.3 percent of houses.<br />
Total damage to houses, 99.9 percent of which are privately owned, included damage to toilets and showers (wet blocks)<br />
and household goods and totaled F$751 million.<br />
The recovery and reconstruction needs are estimated at F$857 million. Total housing reconstruction needs are long term<br />
and households, which are largely uninsured, are expected to incrementally rebuild destroyed and damaged houses<br />
over the next decade. Under a supported, owner-led reconstruction approach, the government has announced an initial<br />
injection of materials grants of up to F$70 million (the Help for Homes initiative). This is for households to construct at least<br />
one cyclone-resilient room (starter home) or undertake preliminary roofing repairs along with coordinated and proactive<br />
building and social advisory support and training to ensure that houses are repaired and reconstructed to an appropriate,<br />
durable standard.<br />
Housing Sector Background<br />
No single public agency in <strong>Fiji</strong> is responsible for housing, and housing-related legislation is spread over at least 14 separate<br />
Acts including, for example, the Town Planning Act, Subdivision of Land Act, Public Health Act, Local Government Act and<br />
<strong>Fiji</strong>an Affairs Act, all administered by different ministries. In an attempt to address the risks inherent in this fragmentation,<br />
in 2011 the government adopted, for the first time, a National Housing Policy, which aims to provide ‘Affordable and<br />
Decent Housing for All.’ It encompasses an ambitious and broad range of measures to address <strong>Fiji</strong>’s housing challenges,<br />
including housing assistance for rural villagers, security of tenure in squatter/informal settlements, coordinated provision of<br />
trunk infrastructure to open up new land for housing, rationalizing rents charged by Native Land Owning Units, provision<br />
of housing finance and regulatory reforms. Importantly, the policy recognizes housing as a private good and as meeting<br />
basic needs, and is a key indicator of social wellbeing. It also strongly endorses the government’s move away from direct<br />
delivery of housing to involvement in activities that create an enabling environment and to working in partnership with the<br />
private sector, NGOs, civil society organizations and communities to address the country’s housing needs. The policy not<br />
only provides a sound framework for development of the housing sector, but it also contains principles and approaches<br />
that would be equally relevant for housing reconstruction following a disaster.<br />
72 Tropical Cyclone Winston, February 20, 2016
FIJI Post-Disaster Needs Assessment<br />
Making use of data available from FBOS 84 and data derived from adjusted modelling undertaken by the 2010 Pacific<br />
Catastrophic Risk Assessment and Financing Initiative (PCRAFI), the population of 182,015 households was calculated to<br />
be living in a total housing stock of some 146,292 units in 2015, indicating a country-wide occupancy rate of around 1.3<br />
households per building although this was not uniform throughout the country. In a number of provinces in the Northern<br />
and Eastern Divisions which are experiencing population out-migration, occupancy rates were below 1, whereas in<br />
the faster growing Central and Western Divisions, and particularly in the Suva-Nausori and Nadi-Ba urban corridors,<br />
occupancy rates were higher at 1.45 per housing unit, indicating that the supply of affordable housing has not kept up with<br />
population growth. 85 In response to unmet demand and opportunities for supplementing household incomes, according to<br />
the 2008/2009 HIES, around one in three families in urban areas rented out at least one room in their house and, deriving<br />
supplementary income from this activity.<br />
The country’s land on which housing is built is codified into three main tenure forms, namely iTaukei (native) land<br />
(87 percent), state land (6 percent) and freehold (7 percent). According to the 2011 National Housing Policy, around 63<br />
percent of households lived on freehold or leasehold land and a further 29 percent lived in village settlements where they<br />
are afforded secure tenure through their community status (Ministry of Local Government, Urban Development, Housing<br />
and Environment, 2011). The high overall security of tenure is reflected in both the quality of the housing stock and median<br />
house size. Table 44 shows the wall materials of the pre-Winston housing stock by division.<br />
Table 44: Housing Stock by Type of Wall Material and Distribution by Division<br />
Division<br />
Concrete<br />
Timber frame/<br />
Wood<br />
Timber frame/<br />
Tin iron<br />
Bure<br />
Makeshift/<br />
Other<br />
Total<br />
No. Units<br />
Central 25,092 12,102 17,676 672 518 56,060<br />
Eastern 2,901 4,691 3,333 207 83 11,215<br />
Northern 2,564 7,122 5,683 539 379 16,287<br />
Western 27,271 9,600 23,660 1,409 790 62,730<br />
Total 57,828 33,515 50,352 2,827 1,770 146,292<br />
Source: MLGHE<br />
The above table indicates that approximately 57 percent of houses consist of reasonably well constructed timber frame<br />
with either wood or tin iron cladding, and a further 40 percent of houses are made of concrete/masonry construction.<br />
Over the years, the use of traditional bure housing has given way to concrete and fixed timber frame construction, which<br />
lends itself to easier fitting of plumbing and electricity supplies. The <strong>Fiji</strong>an vernacular bure house type currently constitutes<br />
only 3 percent of the overall housing stock, although accounting for 10 percent of houses in the Northern Division and<br />
7 percent in the Eastern Division. Drawing on the digitized building footprints collated under PCRAFI, the median floor<br />
area of <strong>Fiji</strong>’s houses are large, around 80m 2 (concrete) and 60m 2 (timber frame), reflecting a mature housing stock that<br />
has been incrementally consolidated by home owners over a number of years. According to a number of construction<br />
industry experts consulted during the course of the PDNA, ‘like-for-like’ house replacement costs would be in the order of<br />
F$750/m 2 for concrete houses and F$650/m 2 for timber frame housing, equivalent to a median house value of F$60,000<br />
(concrete) to F$40,000 (timber frame).<br />
However, the housing characteristics for the estimated 15 percent of the population living in some 240 informal settlements<br />
(primarily located in and around the Lami-Suva-Nausori and Nadi-Lautoka-Ba urban corridors and in Labasa town) point<br />
to less permanent structures. The settlements are far from homogenous, but based on a 2015 survey of 31 informal<br />
settlements, 86 only 10 percent of houses were concrete and the remaining 90 percent were timber frame and tin iron of<br />
varying construction quality and, in many cases, built using recycled materials. The lower quality overall in comparison<br />
to the wider housing stock is likely to reflect variables, such as a higher incidence of poverty found within many informal<br />
settlements and uncertainty regarding tenure security, in particular in those settlements located on privately-owned land. 87<br />
Within the constraints of available statistics, determining the proportion of women headed households who are home or<br />
land owners is not possible. While women’s participation in most types of economic activities is not restricted in <strong>Fiji</strong>, iTaukei<br />
women have limited rights to inherit customary land or to own immovable property and, similarly, patriarchal inheritance<br />
preferences tend to dominate the freehold and leasehold markets. However, under Section 35 of the Bill of Rights in the<br />
84<br />
FBOS, 2011; FBOS, 2007.<br />
85<br />
The concentration of the housing deficit in urban rather than rural areas is also reflected in the fact that although urban areas account<br />
for 51 percent of the population, they account for only 46.3 percent of the housing stock and, by corollary, the 49 percent of the population<br />
which is rural occupies 53.7 percent of the housing stock.<br />
86<br />
Informal settlement survey carried out by the People’s Community Network, November 2015.<br />
87<br />
Informal settlements have grown on all categories of land in <strong>Fiji</strong>. The settlements on state land (including settlements established 40 or<br />
more years ago) tend to be located within town boundaries; settlements on iTaukei land are found within urban areas and also in less<br />
regulated peri-urban areas; and a smaller number of settlements are on freehold land.<br />
Tropical Cyclone Winston, February 20, 2016<br />
73
FIJI Post-Disaster Needs Assessment<br />
2013 Constitution, the State must now “take reasonable measures within its available resources to achieve the progressive<br />
realization of the right of every person to accessible and adequate housing and sanitation.”<br />
In an effort to assist lower income groups, the Government of <strong>Fiji</strong> provides subsidized serviced housing lots and mortgage<br />
loans 88 for home ownership (Housing Authority of <strong>Fiji</strong>) or Public Rental Board apartments. A number of privately established<br />
and funded social (subsidized) housing schemes exist for the extremely poor and destitute, supported by charitable groups<br />
(for example, the Model Towns Charitable Trust), church groups (for example, the Housing Assistance & Relief Trust (HART)<br />
and the People’s Community Network borne out of the Ecumenical Centre for Research, Education and Advocacy), and<br />
NGOs (for example, Habitat for Humanity <strong>Fiji</strong>). The houses under all these schemes are well constructed from concrete or<br />
timber frame/tin iron materials. However, while assisting the housing needs of at least some extremely poor households, as<br />
in most countries, the supply of public and social housing has been unable to keep up with demand. The Housing Authority<br />
market demand survey in 2013 estimated that demand for units was 18,948, most of which (16,816) were in the Central<br />
Division. The Public Rental Board has a waiting list of around 4,600 units. Overall, <strong>Fiji</strong>’s housing stock is largely (90 percent)<br />
in private ownership.<br />
Assessment of Disaster Effects on the Housing Sector (F$777 million)<br />
Damage to the Housing Sector (F$751 million)<br />
Following the cyclone, the divisional administrations under the ministries of Agriculture, Local Government, Housing,<br />
Environment, Infrastructure and Transport undertook field-based assessments to record the damage to housing in all<br />
provinces. The National Disaster Management Office (NDMO) collated the damage information, which was aggregated<br />
and reported at the Tikina (local government) level, and reported figures for destroyed and damaged buildings. Using<br />
the methodologies described in Annex 5: Supplementary Material for Housing Sector, the pre-event baseline residential<br />
building stock (by housing typology) was estimated and the NDMO damage observations were further disaggregated into<br />
major damage (loss of roof or more than 40 percent of damage) and minor damage. The damage disaggregation was<br />
based on a predictive correlation drawn between the materials used in house construction and wind speed data during<br />
the cyclone event (making use of a ‘fragility curve’) and cross-checked through interpretation of satellite imagery and aerial<br />
photographs taken shortly after the cyclone.<br />
Estimated damage to the residential building stock is summarized in Table 45.<br />
Table 45: Damage to the Housing Sector (F$ million)<br />
Total Damage to<br />
Housing<br />
Total Damage<br />
to Household<br />
Goods 89<br />
Total Damage<br />
to Wet Blocks<br />
(Toilet/shower) 90<br />
Total Effects Private Public<br />
660.90 53.8 36.2 751.0 750.3 0.7<br />
Source: Estimations by Assessment Team.<br />
Table 46: Value and Number of Houses 91 Destroyed or Damaged by Division<br />
Division<br />
Number<br />
of Houses<br />
Destroyed<br />
or damaged<br />
Destroyed<br />
Major<br />
damage<br />
Disaster Effects (F$ million)<br />
Minor<br />
damage<br />
Sub-total<br />
Household<br />
goods<br />
Wet block<br />
Central 2,573 37.6 12.0 6.3 55.8 5.1 3.8 64.7<br />
Eastern 2,235 63.0 6.2 2.7 71.9 7.4 4.6 83.9<br />
Northern 7,670 78.7 44.7 22.3 145.6 10.0 7.5 163.1<br />
Western 17,891 252.8 89.7 45.1 387.6 31.3 20.4 439.3<br />
Total 30,369 432.1 152.6 76.4 660.9 53.8 36.2 751.0<br />
Source: Estimations by Assessment Team.<br />
Total<br />
88<br />
Housing finance, in particular mortgage finance, is provided through commercial banks, the Housing Authority, the Home Finance<br />
Company and the <strong>Fiji</strong> National Provident Fund. An estimated 10 percent of the housing stock has been constructed or extended using<br />
mortgage finance.<br />
89<br />
Damage to household goods was estimated for destroyed buildings only.<br />
90<br />
Damage to wet blocks (toilet/shower units) was conservatively estimated to be equal to destroyed houses.<br />
91<br />
This includes house that are destroyed, houses that need major repairs and those that need minor repairs in the four divisions.<br />
74 Tropical Cyclone Winston, February 20, 2016
FIJI Post-Disaster Needs Assessment<br />
The housing sector in the Western Division was the most affected with total damage estimated at F$439 million, followed<br />
by the Northern and Eastern Divisions, respectively. Damaged houses in the Western Division also include those that were<br />
planned and constructed by statutory bodies like the Housing Authority of <strong>Fiji</strong>, the Public Rental Board and HART. This<br />
would account for the F$0.7 million (public) stated in Table 45.<br />
Losses to the Housing Sector (F$26 million)<br />
Both the public and private sectors incurred losses in the housing sector of a combined amount of F$26.4 million. The<br />
breakdown of estimated losses are shown in Table 47.<br />
Table 47: Losses in the Housing Sector by Type (F$ million)<br />
Type of Loss<br />
Total loss of rental income (for single rooms, over 24 month reconstruction period of partial house, at an<br />
average monthly rent of F$200 92 )<br />
Losses<br />
Cost of demolition and rubble removal to lot boundary 0.6<br />
Cost of temporary housing (evacuation centres, including power, food, land, and water and sanitation) 11.9<br />
Cost of temporary housing (transitional shelters under the State of Emergency period) – met by donors 0.5<br />
Total Estimated Cost of Losses 26.4<br />
Source: Estimations by Assessment Team.<br />
13.9<br />
In the immediate aftermath of TC Winston, the government opened a total of 758 designated evacuation centres in all<br />
four divisions, which, at their peak (February 26, 2016), hosted 62,000 men, women and children. Simultaneously, the<br />
government coordinated with a number of relief agencies to distribute tarpaulins, tool kits, food rations and short-term<br />
transitional shelters (tents) to all affected villages as temporary shelter relief for people returning to their own homes. The<br />
strategy was effective in that within 10 days (by April 6, 2016), the majority of internally displaced people had returned to<br />
the sites of their homes and only 14 evacuation centres (in the Western Division) remained open to cater to 223 people. 93<br />
Total costs to the government of this early relief have been met by a budget allocation to the NDMO of F$11.89 million with<br />
donor support of in-kind grants.<br />
On returning to their homesteads, families were faced with the enormous task of salvaging materials for repairing and<br />
rebuilding their homes, and stockpiling the remaining debris for subsequent collection and safe disposal by the authorities.<br />
This stockpiling effort, still underway, is estimated to have cost private households at least F$0.6 million in imputed labour<br />
costs to remove construction demolition waste of the 11,030 houses that were completely destroyed, and possibly more<br />
if the 18,380 houses that were damaged but reparable are taken into account, assuming not all construction demolition<br />
waste can be salvaged for repairs.<br />
The largest loss in the sector is that sustained by private households, who, prior to the cyclone, may have rented out one<br />
or more rooms to supplement their household income. Applying figures from the 2008/2009 HIES to the 2014 estimate<br />
of housing stock, such rentals were being derived from a total of 38,407 houses. As 7.5 percent of the housing stock<br />
was completely destroyed, rental income from at least 2,896 houses where one or more rooms may have been rented<br />
out would be lost. At typical informal market rentals of F$200 per month per room, and assuming households take up to<br />
24 months to rebuild (including an additional room for rental purposes), a loss of household income of F$13.9 million is<br />
expected.<br />
Social Impact of Damage and Losses<br />
The social and psychological impacts on the affected population, in particular in those villages where all homes were<br />
completely destroyed (for example, Koro Island), although difficult to quantify, cannot be overemphasized. One in five<br />
households across the entire country (other than the Rotuma and Kadavu Provinces) have experienced total destruction<br />
of their houses and most personal belongings, or at least some damage to their houses. As most cannot afford to carry<br />
personal or home insurance, households now face the burden of rebuilding themselves, making use of limited personal<br />
savings. With continuing inclement weather, especially in the Western Division, news reports have carried stories of people<br />
sheltering in caves on higher ground. Safety concerns of women and children have been raised and in some villages,<br />
women and children are being provided shelter in churches and with relatives, while housing reconstruction gets underway.<br />
92<br />
Based on a common practice of a household renting out a single room to a second family/individual. According to the HIES 2008-09, 33%<br />
of iTaukei households and 19% of Indo-<strong>Fiji</strong>an households practiced this informal rental.<br />
93<br />
Shortly thereafter, a number of evacuation centres had to reopen to receive people fleeing the flooding caused by a new cyclone, TC Zena.<br />
Tropical Cyclone Winston, February 20, 2016<br />
75
FIJI Post-Disaster Needs Assessment<br />
Different social groups have been affected in distinct ways by TC Winston. Housing serves different functions for different<br />
household members. For example, due to their role in reproductive work and lack of access to jobs in the formal economy,<br />
women often derive income in their homes. Men, on the other hand, use homes for resting and recuperating, and their<br />
economic activities tend to not be home based. For example in Ra and Tailevu (Western and Central Divisions respectively),<br />
most women were engaged in mat and basket weaving at home 94 before the cyclone; however, since the cyclone,<br />
their economic activities have come to a halt due to the destruction of houses, kitchens, raw materials and equipment.<br />
Destruction of homes could, therefore, have more far-reaching consequences for women than men. Homes are places for<br />
nurturing and security for children, and loss of housing is likely to compound the traumatic experience of having endured<br />
a Category 5 cyclone (as noted in Chapter 3.2.2 of this PDNA, which considers the effects of TC Winston on the health<br />
sector). Housing also offers shelter and security for women and young girls from potential violence. While most families<br />
have returned home and are no longer in emergency shelters, many are still seeking shelter with relatives and friends while<br />
waiting to rebuild their homes. Therefore, the lack of access to privacy, and cramped living arrangements with extended<br />
family and friends, can lead to increased vulnerability for exploitation and put women and girls at a heightened risk of sexual<br />
and physical violence.<br />
Such risks are also high for households headed by women who are still living in transitional shelters. Female-headed<br />
households make up about 12 percent of all <strong>Fiji</strong>an households. Assuming that approximately 12 percent (or 3,529) of total<br />
houses destroyed belong to female-headed households, such households would incur total damage and losses in excess<br />
of F$93 million. While female-headed households are usually economically better off than male-headed households, 95<br />
statistics show that female-headed households, where the head is divorced or has never married, have a 71 percent<br />
higher poverty rate, making them susceptible to severe disaster impacts, livelihoods stress and poverty. 96 Homes headed<br />
by single women are, therefore, more likely to be poorly constructed and maintained and, accordingly, to have sustained<br />
extensive damage from TC Winston. Furthermore, households belonging to widows, the elderly, PLWD and single women<br />
may also struggle to rebuild their homes due to a lack of physical strength and/or resources to rebuild quickly.<br />
Home reconstruction programmes should prioritize the most vulnerable households to ensure they have access to resources<br />
to build their homes. The Help for Homes initiative should ensure that the targeting and verification of beneficiaries reaches<br />
the most vulnerable households. The appropriate share of the allocated F$70 million should reach all households that<br />
earn less than F$50,000 a year, including single women, divorced women and widows, PLWD and the elderly, as these<br />
groups are often among the poorest. The data used by the PBS managed by the Ministry of Women, Children and Poverty<br />
Alleviation could be a starting point in identifying the poorest households. Both women and men must also participate and<br />
benefit from home reconstruction programmes. As such, training women in masonry skills to support home construction<br />
could also assist women, who are underrepresented in the labour force, augment their livelihoods.<br />
Recovery and Reconstruction Needs for the Housing Sector (F$857 million)<br />
Early recovery of <strong>Fiji</strong>’s housing sector began through the efforts of private households assisted by government agencies,<br />
the private sector, NGOs and other donors within a week after the cyclone. This included clearing debris in the villages and<br />
salvaging materials for housing and other building repairs.<br />
The government established a dedicated CIU in the Ministry of Finance’s SPO to coordinate the preparation of a recovery<br />
strategy in the housing and other sectors. The CIU has received a wealth of voluntary support from <strong>Fiji</strong>’s private sector,<br />
notably from members of the FIE and from NGOs through the Shelter Cluster, providing detailed technical costing and<br />
recommendations for the future.<br />
On April 9, 2016, H.E. Prime Minister Frank Bainimarama announced the Help for Homes initiative, which is at the core of<br />
the housing reconstruction strategy; an initial amount of F$70 million from the government’s 2016 budget was announced<br />
at the strategy’s launch. The Help for Homes reconstruction strategy recognizes that households are responsible for<br />
rebuilding and repairing their own homes. However, in order to ‘jump start’ private households’ resources, the government<br />
will provide a construction materials grant to every affected household earning less than F$50,000 97 according to the level<br />
of damage. Three grant amounts will be offered as shown in Table 48.<br />
94<br />
Based on interviews conducted by the Department of Social Protection, ILO, UN Women and UNDP on 13 April 2016.<br />
95<br />
This is largely due to the fact that most female-headed households are supported by migrant spouses who sent remittances.<br />
96<br />
<strong>Fiji</strong> Bureau of Statistic 2011: Republic of <strong>Fiji</strong> Poverty Trends, Profiles and Small Area Estimation (poverty maps) in Republic of <strong>Fiji</strong> (2003-<br />
2009).<br />
97<br />
According to the limited available income information (HIES 2008/2009), the average annual income was F$23,000 for urban households<br />
and F$11,068 for rural households. Therefore, almost all affected households are expected to be eligible to receive a materials grant.<br />
76 Tropical Cyclone Winston, February 20, 2016
FIJI Post-Disaster Needs Assessment<br />
Table 48: Materials Grant for Different Levels of Damage in the Housing Sector<br />
Level of Damage Materials Grant Amount (F$) Purpose<br />
Minor damage to the roof 1,500 Sufficient to jump start partial repairs<br />
Major damage to the roof 3,000 Sufficient to jump start partial repairs<br />
House destroyed 7,000 Sufficient to construct one room (15m 2 floor area) and withstand<br />
Category 3 wind speeds<br />
Source: Estimations by Assessment Team.<br />
Following vetting by the Department of Social Welfare, eligible households will be issued e-cards (provided for free by<br />
Vodafone <strong>Fiji</strong> Ltd.) to hold the small grant funds. The e-cards may be used to purchase materials from eligible, pre-qualified<br />
(by the Ministry of Finance) materials suppliers. The e-card system is expected to be effective by May 2016 and the first<br />
round of grants (up to F$70 million) will close in June 2016.<br />
Owner-led housing reconstruction approaches, similar to the Help for Homes initiative, have been successfully implemented<br />
in a number of countries and aim to ensure that limited public funds are spread widely to assist as many affected families<br />
as possible. However, in order to be successful, and to ensure that no household is left behind during the reconstruction,<br />
house repairs are carried out to an acceptable construction standard and suitable building materials (even where salvaged)<br />
are used, the household repairs process must be supported. Ideally and in keeping with a strong rural housing tradition in<br />
<strong>Fiji</strong>, households will initially be encouraged to form ‘buddy’ groups of five to 10 households to work together to purchase<br />
necessary construction materials in bulk and to repair or reconstruct the houses in their group. Furthermore, provinciallybased,<br />
mobile support units consisting of building advisors and community caseworkers will be fielded (contracted in from<br />
the private sector to supplement government staff) to closely monitor progress being made by all households/groups and<br />
to provide on the spot design and construct advice and social counseling as needed. There is a need for: the provision<br />
of pre-approved model house plans 98 that can be incrementally extended; training of local builders in cyclone-resilient<br />
construction; a well-coordinated and ongoing public information and education campaign urging households to make use<br />
of sound construction techniques and properly specified building materials; and information regarding where to obtain<br />
building and counseling advice throughout the reconstruction. Furthermore, particularly in informal settlements where<br />
tenure security is not yet unambiguously recorded, a simple addressing system with occupancy rights may need to be<br />
introduced, where appropriate, to underwrite householders’ own willingness to invest personal resources into the houses.<br />
Overall, approximately 38 percent of building materials will need to be imported; for example, required quantities of suitable<br />
treated framing timber is already in short supply. 99<br />
The government aims to complete the initial phase of Help for Homes recovery within 24 months. These ‘softer’ support<br />
activities should be established as soon as possible and should be fully funded for an initial three years. They should then be<br />
funded at a lower level of intensity for an additional two to three years, recognizing that once households have undertaken<br />
initial repairs/construction of one room with the Help for Homes materials grants, incremental improvements and additions<br />
will continue to be made to the homes over many years by households using only their own resources. Full recovery of<br />
the housing sector to pre-Winston levels (particularly in regards to the size of houses) and incrementally strengthening the<br />
housing stock for future extreme weather events is likely to take at least a decade to achieve.<br />
The value of the total recovery and reconstruction needs for the housing sector are F$857.3 million. Table 49 provides<br />
the breakdown of total recovery needs for the housing sector. More information on how the recovery will make use of<br />
the supported owner-group reconstruction approach (Help for Homes) is set out in Annex 5: Supplementary Material for<br />
Housing Sector.<br />
Table 49: Total Recovery and Reconstruction Needs for the Housing Sector (F$ million)<br />
Preparatory work and strengthening the<br />
regulatory and technical environment<br />
Design, construction and reconstruction of<br />
homes, and replacement of household items<br />
Recovery Reconstruction Resilience Total<br />
0.3 19.5 19.8<br />
834.1 834.1<br />
Transportation costs 3.4 3.4<br />
Total 0.3 857.0 857.3<br />
Source: Estimations by Assessment Team.<br />
Note: A detailed breakdown of recovery needs by sector is included in Annex 2.<br />
98<br />
The house plans also should incorporate design features to counter domestic violence risks, for example, two external doors on the main<br />
room.<br />
99<br />
According to one expert opinion, over and above the normal framing timber requirements, the short-term housing reconstruction needs<br />
show an immediate shortfall of 10,000 m 3 treated framing timber.<br />
Tropical Cyclone Winston, February 20, 2016<br />
77
FIJI Post-Disaster Needs Assessment<br />
Damaged road on Taveuni Island<br />
Source: Vlad Sokhin/World Bank<br />
3.3 Infrastructure Sectors<br />
3.3.1 Transport<br />
Summary<br />
Total damage and losses to the transport sector, including land, maritime and aviation, are estimated at F$129.5 million,<br />
with estimated damage of F$127.1 million and losses of F$2.4 million. The majority of damage is concentrated on land<br />
transport assets, where TC Winston caused widespread coastal erosion and bridge and crossing washouts. The islands of<br />
Koro and Ovalau (both in the Eastern Division), and Taveuni (in the Northern Division), are among the most heavily affected.<br />
The majority of economic losses is a result of longer travel times and higher vehicle operating costs. Total recovery and<br />
reconstruction needs have been estimated at F$177.9 million, and are expected to be met through revised government<br />
budgets, insurance claims and reorientation of the ongoing ADB/World Bank-financed Transport Infrastructure Investment<br />
Project.<br />
Transport Sector Background<br />
Transport infrastructure and services underpin <strong>Fiji</strong>’s economic growth and social development. Rural industries, such as<br />
sugar cane farming, forestry and tourism, rely on road access (e.g., from plantations to processing plants). Remote rural<br />
and island communities in <strong>Fiji</strong> depend on rural access roads, rural jetties, and safe and reliable maritime and aviation routes<br />
in order to access economic opportunities and social services. Tourism is <strong>Fiji</strong>’s primary foreign exchange earner and relies<br />
on safe and efficient mobility, internal freight distribution and, increasingly, port facilities, safe and well-charted shipping<br />
lanes, and access to island destinations.<br />
<strong>Fiji</strong>’s topography has restricted the road network to spine or circumferential main roads along the coast with feeder roads,<br />
with few alternate routes. In the main urban areas, many lower-level municipal roads have suffered from neglect and are<br />
in poor condition. Inter-island freight and passenger transport relies on serviceable coastal and island jetties, adequate<br />
navigation aids, domestic airfields, and reliable and safe domestic shipping and aviation services.<br />
The Ministry of Infrastructure and Transport is responsible for the management of policy, administration and regulatory<br />
activities of all transport modes. The <strong>Fiji</strong> Roads Authority (FRA) manages the country’s road assets and bridges, as well as<br />
the country’s wharves and domestic jetties, excluding international ports. Assets managed by the FRA are shown in Table<br />
50. The FRA’s funding requirements are currently met by government capital and operating grants, and loan financing.<br />
Airports <strong>Fiji</strong> Limited (AFL) manages international and domestic airfields.<br />
Land Transport: The FRA is currently implementing a project jointly financed by ADB and World Bank loans and has<br />
recently implemented several other externally financed projects through the China Export-Import Bank and the Malaysia<br />
Export-Import Bank. It has a contract with an international firm to provide engineering services associated with the 10,000<br />
78 Tropical Cyclone Winston, February 20, 2016
FIJI Post-Disaster Needs Assessment<br />
kilometer plus road network, bridges and jetties. Several international contractors as well as an active domestic contractor<br />
industry provide construction services.<br />
Maritime Transport: The Maritime Safety Administration of <strong>Fiji</strong> (MSAF) manages regulation of maritime safety, marine<br />
environmental protection, port security, and search and rescue and hydrographical services. MSAF is also responsible for<br />
providing navigation aids, including 80 lighthouses and 100 beacons.<br />
Table 50: <strong>Fiji</strong> Road Authority Assets by Division<br />
Division Roads (kilometers) Bridges Jetties<br />
Sealed Unsealed Total<br />
Central/Eastern 675 1,681 2,356 427 30<br />
Northern 677 2,406 3,083 440 4<br />
Western 357 1,730 2, 087 384 13<br />
Total 1, 709 5, 817 7, 526 1,251 47<br />
Source: FRA.<br />
Domestic inter-island shipping services are provided through three main mechanisms: (i) the Government Shipping<br />
Services; (ii) the Shipping Franchise Scheme; and (iii) commercial routes. The Government Shipping Services operates a<br />
small fleet of vessels, primarily for use by other government departments in servicing development and ongoing work on<br />
the outer islands. The Shipping Franchise Scheme provides inter-island shipping services on non-commercial routes, by<br />
engaging private operators to service each route for an agreed subsidy that is competitively tendered on a minimum basis<br />
for a fixed time period.<br />
<strong>Fiji</strong> Ports Corporation Limited (FPCL) manages five of the six declared ports of entry in <strong>Fiji</strong>, and facilitates the provision of<br />
port services, including pilotage, tugs and other marine services, at a privately owned port. FPCL is responsible for ensuring<br />
the maintenance of safety and environmental standards within each port, and was privatized by the government in 2015.<br />
Aviation: AFL, a state-owned enterprise managed by the Ministry of Public Enterprises, operates airports in Nadi and<br />
Nausori, both of which service international and domestic flights, and manages 13 domestic airports on the outer islands.<br />
Other private airstrips are owned by hotels and resorts.<br />
Assessment of Disaster Effects on the Transport Sector (F$129 million)<br />
Total damage and production losses sustained by the transport sector are estimated at F$129.5 million. The largest effects<br />
were sustained by land transport infrastructure, including roads and associated structures and buildings (F$108.4 million),<br />
followed by maritime transport assets (F$17.6 million) 100 and aviation infrastructure (F$3.4 million).<br />
Damage to the Transport Sector (F$127 million)<br />
Total damage sustained by the transport sector is estimated at F$127.1 million. Figure 24 illustrates the distribution of<br />
damage sustained by each subsector, while Figure 25 illustrates the breakdown of damage sustained in each division.<br />
Maritime F$17.6<br />
Aviaition F$3.4<br />
Maritime<br />
Land Transport<br />
Aviaition<br />
Land Transport<br />
F$106.1<br />
Figure 24: Damage to the Transport Sector by Subsector (F$ million)<br />
Source: Estimations by Assessment Team.<br />
100<br />
The figure does not include damages to private sector vessels, as damage estimates were obtained too late in the PDNA process to be<br />
included<br />
Tropical Cyclone Winston, February 20, 2016<br />
79
FIJI Post-Disaster Needs Assessment<br />
Western<br />
F$29.9<br />
Northern<br />
F$32.9<br />
Central<br />
F$14.4<br />
Eastern<br />
F$49.9<br />
Western<br />
Northern<br />
Eastern<br />
Central<br />
Figure 25: Damage to the Transport Sector by Division (F$ million)<br />
Source: Estimations by Assessment Team<br />
Land Transport: Damaged land transport assets include: roads; bridge approaches, which undermine the structural<br />
integrity of bridges; bridges and crossings; seawalls; and associated structures, such as bus shelters, signs, traffic signals<br />
and streetlights. A large proportion of this damage is due to seawall erosion caused by the cyclone in affected areas in<br />
the Eastern and Northern Divisions, particularly on Koro, Ovalau and Taveuni Islands. In addition, accumulation of debris<br />
caused widespread damage and washouts to bridges, crossing structures and their approaches, with the majority of these<br />
waterway damage sustained on Viti Levu in both the Central and Western Divisions, and in Taveuni in the Northern Division.<br />
The overall extent of the damage to roads may not be fully evident for some time, as water may have penetrated the surface<br />
and affected the base and sub-base courses, which could eventually cause some roadway sections to subside.<br />
Maritime Transport: Maritime transport assets damaged by TC Winston include rural jetties, navigation aids, channel<br />
markers, lighthouses and international ports, including the associated port terminal buildings. Rural jetties accounted for<br />
the largest proportion of damage in the subsector, particularly the Lomaloma jetty at Vanua Balavu in the Eastern Division,<br />
which became inaccessible due to severe causeway damage near the jetty head and will require significant rehabilitation.<br />
Damage to rural jetties was a result of king tides and heavy swells that mostly eroded the causeway structures.<br />
Aviation: Damaged aviation subsector assets include runways, terminal buildings and security fences at the Nadi, Taveuni<br />
and Savusavu airports. Debris on the runways was cleared following the cyclone.<br />
Figure 26: Damage Sites in the Central, Western and<br />
Eastern Divisions<br />
Source: Assessment Team.<br />
Figure 27: Damage Sites in the Northern and Eastern<br />
Divisions<br />
Source: Assessment Team.<br />
Losses to the Transport Sector (F$2 million)<br />
Total losses sustained by the transport sector are estimated at F$2.4 million, with the majority of recorded losses incurred<br />
in the land and maritime subsectors.<br />
Land Transport: Total losses sustained to land transport are estimated at F$2.4 million. Losses relate mainly to higher<br />
vehicle operating costs and passenger travel times along key national corridors, which were disconnected due to the<br />
presence of debris on roads, or bridge washouts and approach scouring. In particular, trip durations increased significantly<br />
between Suva-Nadi, Nadi-Lautoka, Lautoka-Rakiraki, Rakiraki-Suva and Labasa-Savusavu, and even doubled along<br />
selected sections of roads. The Nadi-Suva and Labasa-Savusavu corridors required up to a week from the disaster to<br />
restore normal connectivity, while the remaining sections took up to three weeks.<br />
80 Tropical Cyclone Winston, February 20, 2016
FIJI Post-Disaster Needs Assessment<br />
Maritime Transport: FPCL incurred economic losses resulting from lost rentals from the terminal buildings at the ports in<br />
Suva, Lautoka and Levuka, which were all damaged by the disaster. FPCL’s revenues also declined following the disaster<br />
by providing wharfage concessions for humanitarian relief vessels, with a fixed ceiling on the concession in place.<br />
Aviation: TC Winston resulted in minor losses to the aviation sector due to the cancellation of international flights to and<br />
from <strong>Fiji</strong>. 101 While these economic impacts were not recorded, AFL likely lost revenue from landing fees, but not from<br />
cancelled flights in the other 13 outer island domestic airfields, as they do not generate revenue. Losses were also incurred<br />
as a result of overtime paid to AFL workers, although these figures were also not recorded as they became available too<br />
late in the PDNA process.<br />
Table 51: Damage and Losses in the Transport Sector (F$ million)<br />
Damage Loss Total Public (%) Private (%)<br />
Land 106.1 2.4 108.5 98 2<br />
Maritime 17.6 0.04 17.6 95 5<br />
Aviation 3.4 0 a 3.4 100 0<br />
Total 127.1 2.4 129.5 98 2<br />
Source: Estimations by Assessment Team.<br />
a<br />
Losses for aviation were not recorded, although AFL likely lost revenue from landing fees.<br />
Table 52: Damage and Losses in the Transport Sector by Division (F$ million)<br />
Division Damage Loss Total Public (%) Private (%)<br />
Central 14.4 1.3 15.7 8 92<br />
Eastern 49.9 0.0 49.9 1 99<br />
Northern 32.9 0.2 33.1 1 99<br />
Western 29.9 0.9 30.8 3 97<br />
Sector Total 127.1 2.4 129.5 2 98<br />
Source: Estimations by Assessment Team.<br />
Social Impact of Damage and Losses<br />
The social impact of the disaster on the transport sector is significant. People in the affected areas would have experienced<br />
difficulty in undertaking travel to fulfill their livelihoods in the wake of the disaster. In addition, damage to vessels operating<br />
commercial routes disconnected people from economic opportunities and key social services. For example, the main<br />
access corridor linking Lautoka to Rakiraki was affected for up to three weeks, impacting the livelihoods of sugar cane<br />
farmers and exporters.<br />
Recovery and Reconstruction Needs in the Transport Sector (F$178 million)<br />
Total recovery needs for the transport sector are estimated at F$3.2 million and total reconstruction needs at F$174.7<br />
million.<br />
Recovery needs include restoration of road connectivity along the main transport corridors between Suva-Nadi, Nadi-<br />
Lautoka, Lautoka-Rakiraki, Rakiraki-Suva and Labasa-Savusavu. The road networks were mostly blocked by debris that<br />
needed to be cleared by FRA’s maintenance contractors. Also, the washed out bridge approach to Yaqara Bridge, a key<br />
link between Rakiraki and Suva, requires refilling and connectivity to be restored. The value of this work being undertaken<br />
by FRA is estimated at F$2.8 million.<br />
Similarly for AFL, immediate work included clearing debris from the airport runways and repairing security fences in the<br />
affected areas of Savusavu, Taveuni and Koro. Expenses have included travel allowances for AFL staff undertaking the<br />
repairs.<br />
Reconstruction needs across all three subsectors are estimated at F$174.7 million, with the majority of these needs<br />
required for FRA assets. Reconstruction needs were estimated taking BBB into consideration. In particular, higher and<br />
longer spans for selected bridges and crossings would allow the flow of debris to prevent washouts in future extreme<br />
events. Bridge and crossing approaches should also be repaired with appropriate retaining structures to withstand future<br />
floods. Moreover, seawalls need to be rebuilt with stronger foundations to mitigate against further erosion that would affect<br />
101<br />
On Saturday, February 20, only three <strong>Fiji</strong> Airways flights departed, and all were cancelled for Sunday. All Virgin and Jet Star flights were<br />
cancelled on Saturday and Sunday. Limited flights resumed on Monday and full service was restored on Tuesday.<br />
Tropical Cyclone Winston, February 20, 2016<br />
81
FIJI Post-Disaster Needs Assessment<br />
coastal roads, bridges and rural jetties. Repairing associated facilities, such as bus shelters, signage and streetlights, is<br />
also required. To meet these needs, the government is expected to adjust its budget and reorient the ADB/WB-financed<br />
Transport Infrastructure Investment Project, which is currently being implemented.<br />
Port and airport building reconstruction is expected to be completed in 2016. The repair of navigation aids by MSAF is<br />
expected to be met through its operational budget. MSAF will also continue to implement its maintenance budget to ensure<br />
that all navigation aids meet international standards as required by the International Association of Lighthouse Authorities.<br />
Table 53: Total Recovery and Reconstruction Needs for the Transport Sector (F$ million)<br />
Recovery Reconstruction Resilience Total<br />
Road 2.8 131.2 0.0 134.0<br />
Maritime 0.3 37.0 0.0 37.3<br />
Aviation 0.1<br />
6.5<br />
0.0 6.6<br />
Total 3.2 174.7 0.0 177.9<br />
Source: Estimations by Assessment Team.<br />
Note: A detailed breakdown of recovery needs by sector is included in Annex 2.<br />
3.3.2 Water and Sanitation<br />
This sector includes consideration of water, sanitation and solid waste. Total damage and loss incurred as a result of<br />
TC Winston in the water and sanitation sector is estimated to be F$24.8 million, consisting of F$16.9 million in damage<br />
and F$7.9 million in losses. Total recovery and reconstruction needs are estimated to be F$24.3 million. Geographical<br />
distributions are shown in Figure 28, with the breakdown by division in Figure 29.<br />
Topics proposed for the recovery strategy are BBB for water and sanitation infrastructure and strengthening monitoring<br />
mechanisms, including the role of the Ministry of Infrastructure for monitoring rural water schemes and enhancing water<br />
quality testing capacities of drinking water treatment plants.<br />
Figure 28: Geographical Distribution of Recovery and Reconstruction (F$ million)<br />
Source: Estimations by Assessment Team.<br />
82 Tropical Cyclone Winston, February 20, 2016
FIJI Post-Disaster Needs Assessment<br />
12<br />
Damage Loss Need<br />
10<br />
F$ million<br />
8<br />
6<br />
4<br />
2<br />
0<br />
Central Eastern Northern Western<br />
Figure 29: Damage, Losses and Needs by Division<br />
Source: Estimations by Assessment Team.<br />
Water, Sanitation and Solid Waste Sector Background<br />
The 2013 <strong>Fiji</strong> Constitution guarantees the right of all people to adequate clean and safe water and sanitation, with legislative<br />
or procedural frameworks covering water and sanitation already in place. 102<br />
Water: Urban water supply and sanitation is managed by the Water Authority of <strong>Fiji</strong> (WAF) and regulated by the Department<br />
of Water and Sewerage, within the Ministry of Infrastructure and Transport. Water quality is monitored by the MoHMS.<br />
Rural water schemes are administered by WAF with regulation and technical oversight by the Ministry of Infrastructure and<br />
Transport, while operation and management is carried out by local communities. Over 2,500 rural water schemes exist. 103<br />
WAF is a commercial statutory authority and provides water supply services to approximately 151,000 accounts. The nonrevenue<br />
water (i.e., due to system leakage, etc.) accounted for 35-45 percent of total production as of December 2015.<br />
Approximately F$110 million is spent annually to upgrade water and sewerage infrastructure in urban systems. Enhanced<br />
asset management, including inspection and maintenance, is needed.<br />
Sanitation: Eleven urban sewerage systems exist and are managed by WAF. However, the majority of urban and rural<br />
customers are not connected to formal sewerage systems and rely on onsite wastewater management facilities, such as<br />
septic tanks, which they construct and manage themselves. A number of private sector companies provide septic tank<br />
bailing services on a user pay basis; however, their services do not extend to the rural villages. Insufficient infrastructure and<br />
maintenance for rural onsite wastewater systems poses both health and environmental risks.<br />
Solid Waste: Urban solid waste collection in <strong>Fiji</strong> is managed by respective city councils with regulation by the Ministry of<br />
Infrastructure and Transport. The annual weight of urban waste generated was approximately 315,000 tons as of 2015<br />
and annual disposal costs were estimated at F$7.9 million. No formal system exists for rural solid waste collection and<br />
disposal. The annual weight of rural waste generated was estimated at 78,300 tons leading to indirect disposal costs of<br />
F$6.5 million. Table 54 provides an overview of existing infrastructure for the water and sanitation sector.<br />
Table 54: Water- and Sanitation-Related Infrastructure (number of facilities)<br />
Existing Infrastructure Division Total<br />
Central Eastern Northern Western<br />
Intakes 12 13 22 17 64<br />
Treatment Plants 8 6 19 11 44<br />
Reservoirs 32 24 31 34 121<br />
Distribution Network 7 7 4 7 25<br />
Drinking Water Pumping Stations 17 14 17 48<br />
Drinking Water Pumps 72 23 39 134<br />
Rural Water Schemes 435 393 1,109 621 2,558<br />
102<br />
The Public Health Act (1936), Environmental Management Act (2005), Green Growth Framework (2014), Water Supply Act (1955, ed. 1985),<br />
River and Streams Act (1882, ed. 1985), Town Planning Act (1946, ed. 1978), Water Authority of <strong>Fiji</strong> Promulgation (2007), Rural Water and<br />
Sanitation Policy (2012), Water and Sewerage Act (currently being developed), <strong>Fiji</strong> National Drinking Water Quality Standards, rural water<br />
schemes?<br />
103<br />
Other water uses are managed respectively by the MOA for irrigation, <strong>Fiji</strong> Energy Authority for hydroelectricity, operation and management<br />
by municipalities, Public Works Department for construction, operation and management of urban drainage, MOA (limited areas) and <strong>Fiji</strong><br />
Roads Authority (limited areas) for flood control.<br />
Tropical Cyclone Winston, February 20, 2016<br />
83
FIJI Post-Disaster Needs Assessment<br />
Existing Infrastructure Division Total<br />
Central Eastern Northern Western<br />
Ecological Purification Systems 12 2 14 14 42<br />
Wastewater Treatment Plants 6 1 4 11<br />
Wastewater Pumping Stations 98 16 58 172<br />
Wastewater Pumps 218 32 122 372<br />
Urban Waste Management Schemes 4 3 2 4 13<br />
Source: WAF.<br />
Assessment of Disaster Effects on the Water and Sanitation Sector (F$25 million)<br />
Damage to the Water and Sanitation Sector (F$17 million)<br />
The total damage to the water and sanitation sector was estimated to be F$16.9 million.<br />
Water: WAF services were severely affected by debris, strong winds, rainfall and surface flooding, storm surges and<br />
system failures due to power outages. 532 rural water schemes were also affected with damaged pipes and restricted<br />
access to clean water sources. Damage to WAF assets included:<br />
<br />
<br />
<br />
<br />
<br />
<br />
Sanitation: Damage to wastewater management and sanitary facilities, such as toilet and household septic tanks, affected<br />
approximately 20,500 households. Damage to WAF sanitation assets included tearing of liners of wastewater treatment<br />
lagoons, and damage to pumping station equipment and property.<br />
Solid Waste: According to the Ministry of Local Government, Housing, Environment, Infrastructure and Transport, no<br />
damage to solid waste-related infrastructure occurred.<br />
Losses to the Water and Sanitation Sector (F$8 million)<br />
Water and Sanitation: Losses to the sector are derived from higher operating costs and lower operational revenues.<br />
WAF mobilized power generators to operate pumping stations where possible, and, in other cases, provided water carting<br />
services and bailing until water supply systems were operational. As a result, WAF incurred significant unanticipated costs<br />
amounting to an estimated F$4.4 million for emergency purchasing of generators, hiring water trucks, hiring wastewater<br />
bailing trucks and paying staff overtime. In addition, the estimated revenue loss due to water supplies reaching fewer<br />
customers was F$0.06 million.<br />
Solid Waste: According to data obtained from the Ministry of Infrastructure and Transport, an estimated 31,300 tons<br />
of waste was disposed in urban waste management systems, including 102 tons of food, which was condemned by<br />
municipal sanitary health inspectors as unfit for consumption following power interruption. Organic waste (e.g., coconut<br />
fronds, tree branches, etc.) was carted to disposal sites or, in the case of the Suva City Council, composted in parks for<br />
reuse. Local governments provided free service to pick up solid waste from individual properties and public areas, with<br />
assistance from the <strong>Fiji</strong> Military Force, <strong>Fiji</strong> Corrections Service and the National Fire Authority. The cost for disposing waste<br />
in landfills was estimated at F$0.8 million, and extra operation costs for hiring waste collection vehicles amounted to<br />
F$1.4 million. The rural waste that was generated was estimated to be 15,700 tons, and indirect management costs were<br />
estimated at F$1.3 million.<br />
The cost of waste collection and disposal was partly covered by municipal contingency funds, which are F$0.1 million<br />
each. This funding is allocated each year and redistributed at the end of the year when there are no contingencies.<br />
Table 55: Damage and Losses in the Water and Sanitation Sector by Subsector (F$ million)<br />
Subsector Damage Losses Total Effects<br />
Water 16.5 3.9 20.4<br />
Sanitation 0.4 0.5 0.9<br />
Solid waste 0.0 3.5 3.5<br />
Total 16.9 7.9 24.8<br />
Source: Estimations by Assessment Team.<br />
84 Tropical Cyclone Winston, February 20, 2016
FIJI Post-Disaster Needs Assessment<br />
Table 56: Damage and Losses in the Water and Sanitation Sector by Division (F$ million)<br />
Division Damage Losses Total Effects<br />
Central 2.9 2.3 5.2<br />
Eastern 1.9 0.2 2.1<br />
Northern 4.5 0.7 5.2<br />
Western 7.6 4.7 12.3<br />
Total 16.9 7.9 24.8<br />
Source: Estimations by Assessment Team.<br />
Table 57: Damage and Losses in the Water and Sanitation Sector by Ownership (F$ million)<br />
Private Public Total<br />
Damage 0.0 16.9 16.9<br />
Loss 0.1 7.8 7.9<br />
Total 0.1 24.7 24.8<br />
Source: Estimations by Assessment Team.<br />
Social Impact of Damage and Losses<br />
Anecdotal information relates to water transportation over longer distances. 104 The humanitarian response WASH Cluster<br />
distributed supplies (e.g., purification tablets and hygiene kits) to 24,000 people. The WAF network experienced power<br />
outages, which affected the water supply and wastewater systems. Increased risks and vulnerabilities from the disaster<br />
included public health concerns due to the existence of solid waste in public and private areas. The municipalities addressed<br />
this by increasing operational costs and, accordingly, all the excess waste was collected by March 31.<br />
Restoring access to the water supply and sanitation services is critical to reducing public health and safety risks, particularly<br />
for women and girls, who are largely responsible for household water security and sanitation. Thus, water supply disruptions<br />
caused by TC Winston disproportionately impacted on women and girls who had to spend more time fetching clean water,<br />
especially in the days immediately following the cyclone. For example:<br />
<br />
<br />
<br />
<br />
water to meet their daily requirements.<br />
<br />
water.<br />
<br />
identified water storage and access to clean water as a priority that must still be addressed.<br />
Limited access to water combined with disruptions to the electricity supply in some affected areas also means that the<br />
time required to do laundry has increased from about 30 minutes to three hours. In areas where the water supply remains<br />
disrupted, the ability of women and girls to engage in other productive and income-generating activities has been curtailed.<br />
Even in places where water is being supplied, the amount provided is less than the normal household daily intake before<br />
the cyclone. This decreased supply could compromise the ability of households to manage their waste needs and could<br />
lead to a deterioration in sanitary conditions, especially in light of continued rains.<br />
Lack of proper sanitation and access to clean water poses a health threat to women and girls, in particular, given their role<br />
in providing water and ensuring water security. In general, reduced water quantity and quality in response to reduced water<br />
supply could create health problems for women and children under five.<br />
The Damage to WASH facilities, lack of privacy and segregated facilities, and poor light resulting from TC Winston could<br />
increase the risk of sexual and gender-based violence (SGBV) to women and girls. As most of the rural water supply is<br />
through rural water schemes, enabling communities to restore their water supply should be prioritized in order to reduce<br />
the burden that women and girls are currently facing in securing household water and maintaining good sanitary conditions.<br />
104<br />
An attempt at estimating rural loss is as follows, but is not included in the overall figures of this report: extra water bought or transported<br />
longer distances for communities not covered by urban or rural water schemes – F$0.9 million; and increased costs due to insufficient<br />
disposal of liquid and solid waste – F$0.8 million.<br />
Tropical Cyclone Winston, February 20, 2016<br />
85
FIJI Post-Disaster Needs Assessment<br />
Recovery and Reconstruction Needs for the Water and Sanitation Sector (F$24 million)<br />
Total recovery costs are estimated at F$3.6 million, and total reconstruction costs in 2016 and 2017 are estimated at<br />
F$20.7 million with details shown in Table 58. Specific needs raised by city councils include paving access roads to landfill<br />
sites and construction of transfer stations.<br />
The recovery strategy needs to be aligned with existing development frameworks, such as the <strong>Fiji</strong> Green Growth Framework.<br />
It also must adhere to the principles of BBB and advocate and strengthen resilience in water and sanitation systems to<br />
ensure communities have access to reliable and safe water supply and sanitation services at all times. Strengthening the<br />
engagement of rural village committees and leaders in WASH systems is also an area requiring further support through<br />
relevant government authorities and partners. The amount and restrictions around the municipal contingency funding<br />
scheme should be reviewed on a medium-term basis.<br />
Table 58: Total Recovery and Reconstruction Needs for the Water and Sanitation Sector (F$ million)<br />
Recovery Reconstruction Resilience Total<br />
Repair and reconstruction of WAF assets 16.43 16.43<br />
Repair or buy new water storage tanks, fees for carting,<br />
water monitoring and testing, rural water schemes<br />
Urban waste disposal costs, upgrade waste water<br />
treatment plants (add mechanical screens)<br />
1.11 3.50 4.61<br />
2.20 0.11 2.31<br />
Purchase generator sets 0.25 0.25<br />
Strengthen institutional capacity in sector, including<br />
provision of experienced advisor with technical expertise<br />
of water treatment in the strategic planning department<br />
in WAF, review of tariff, preparation of water and waste<br />
management plans<br />
0.04 0.01 0.05<br />
Pave access road to landfills 0.23 0.23<br />
Build transfer stations for solid waste 0.40 0.40<br />
Total 3.6 20.7 24.3<br />
Source: Estimations by Assessment Team.<br />
Note: A detailed breakdown of recovery needs by sector is included in Annex 2.<br />
3.3.3 Electricity<br />
Summary<br />
Following TC Winston, the power supply was disrupted to all FEA customers. Full reconnection is anticipated by June<br />
or July 2016. An estimated 1,500 residential customers whose homes were destroyed are expected to be reconnected<br />
progressively over the next 12 months as reconstruction proceeds. TC Winston caused significant damage to the<br />
distribution grid and somewhat lower levels of damage to power generation and transmission infrastructures.<br />
Damage to the Department of Energy’s (DoE) rural power generation assets was significant, with approximately 54 diesel<br />
mini-grids and 609 solar home systems affected.<br />
Total damage and loss in the electricity sector is estimated at F$41.1 million, consisting of F$33 million for the replacement<br />
of damaged power sector infrastructure and F$8.1 million in losses to FEA, mainly from loss of revenue.<br />
Electricity Sector Background<br />
FEA is a government-owned statutory agency that is responsible for the generation, transmission, distribution and retail<br />
sale of electricity in <strong>Fiji</strong>. It operates four separate power grids on Viti Levu, Vanua Levu (Labasa and Savusavu) and Ovalau,<br />
and produces electricity from a mix of diesel, hydropower and wind. During the 12-month period from January 2015<br />
to December 2015, FEA generated 892,045MWh (megawatt hours) of energy with system losses (both technical and<br />
nontechnical) 105 of 9.65 percent. Over the same period, FEA had total electricity sales revenue of F$312 million. A summary<br />
of baseline power assets is presented in Table 59.<br />
105<br />
Technical losses are physical losses (e.g., thermal losses), while nontechnical losses are those that FEA incurs through meter fraud,<br />
illicit connections, etc.<br />
86 Tropical Cyclone Winston, February 20, 2016
FIJI Post-Disaster Needs Assessment<br />
Damaged power lines on Kings Road near Rakiraki, Ra Province, Viti Levu<br />
Source: Vlad Sokhin/World Bank<br />
DoE provides power to a number of rural areas either through diesel-based mini-grids or solar home systems.<br />
Diesel-based mini-grids are installed by DoE and progressively transferred to community ownership. Since 1976,<br />
DoE has installed approximately 419 diesel-based mini-grids in rural areas, most of which have been transferred to<br />
local communities for operation and maintenance.<br />
<br />
Solar home systems for rural households are owned by DoE and are rented to the households for a fee. DoE<br />
supplies approximately 4,534 solar home systems to rural households.<br />
Table 59: Baseline Assets in the Power Sector, January 2016<br />
Site<br />
Hydropower Generation (FEA)<br />
Monasavu Hydropower – Viti Levu<br />
Nadarivatu Hydropower – Viti Levu<br />
Wainikasou Hydropower – Viti Levu<br />
Nagado Hydropower – Viti Levu<br />
Wainiqeu Hydropower - Vanua Levu<br />
Diesel Generation (FEA)<br />
Kinoya Power Station – Viti Levu<br />
New Kinoya Power Station – Viti Levu<br />
Rokobili Power Station – Viti Levu<br />
Deuba Power Station – Viti Levu<br />
Sigatoka Power Station – Viti Levu<br />
Qeleloa Power Station – Viti Levu<br />
Nadi Power Station – Viti Levu<br />
Vuda Power Station – Viti Levu<br />
Rakiraki Power Station – Viti Levu<br />
Korovou Power Station – Viti Levu<br />
Levuka Power Station – Ovalau<br />
Generation<br />
72MW<br />
40MW<br />
6MW<br />
1MW<br />
0.8MW<br />
40MW<br />
30MW<br />
12.8MW<br />
3.3MW<br />
9MW<br />
6.2MW<br />
7.6MW<br />
20MW<br />
1.6MW<br />
0.4MW<br />
2.3MW<br />
Tropical Cyclone Winston, February 20, 2016<br />
87
FIJI Post-Disaster Needs Assessment<br />
Site<br />
Labasa Power Station – Vanua Levu<br />
Savusavu Power Station – Vanua Levu<br />
Renewable Energy (FEA)<br />
Butoni Wind Farm<br />
Total installed capacity<br />
Transmission (FEA)<br />
132kV line<br />
33kV line<br />
Distribution (FEA)<br />
11kV and 415/220V line<br />
Rural Electrification (DoE)<br />
Solar household systems<br />
Diesel mini-grids<br />
Generation<br />
10.7MW<br />
3.7MW<br />
9.90MW<br />
277.25MW<br />
147.2km<br />
453.4km<br />
9,129km<br />
4,534 systems<br />
419 systems<br />
Source: <strong>Fiji</strong> Electrical Authority.<br />
MW = megawatt; kV = kilovolt.<br />
Assessment of Disaster Effects on the Electricity Sector (F$41 million)<br />
Damage to the Electricity Sector (F$33 million)<br />
Total damage to the electricity sector is estimated to be F$33 million, and includes damage to FEA generation, transmission,<br />
distribution, communication, retail assets and buildings, as well as to DoE rural power systems.<br />
Major damage to FEA power sector assets occurred in the Western and Eastern Divisions. DoE rural power sector assets<br />
were mostly affected in the Eastern, Western and Northern Divisions. A summary of damage to assets by division is<br />
presented in Table 60.<br />
Table 60: Damage to the Power Sector by Division (percent of assets damaged)<br />
Central Eastern Western Northern<br />
FEA generation, transmission and communication 0 15 15 0<br />
FEA distribution lines (11kV and 415/240V) 30 80 75 30<br />
Rural solar home systems (DoE managed) n/a 17 53 20<br />
Rural diesel grids (DoE/Community managed) n/a 22 2 8<br />
Source: <strong>Fiji</strong> Electricity Authority; Department of Energy.<br />
kV = kilovolt; n/a = not applicable (no assets in this region).<br />
FEA Generation Assets: As a result of TC Winston, buildings at six of FEA’s 15 power generation plants suffered minor<br />
structural damage, and generators at three power plants suffered water damage. Emergency repairs were completed and<br />
full generation capacity was restored within one week of the cyclone, except at the Nadarivatu Power Station, which was<br />
switched on after four weeks. Although the Nadarivatu Power Station did not sustain any damage, one of the towers on<br />
the main transmission line fell and temporary repairs were required before power could be restored. Medium-term repairs<br />
will be required on the power plant structures following the emergency phase.<br />
FEA Transmission Assets: Damage was sustained to both the 132kV (kilovolt) transmission line network and the 33kV<br />
subtransmission line network, predominantly in the Western Division. All transmission assets were operational by March<br />
20, 2016, although some works were temporary and will require medium- to long-term investments for full rehabilitation.<br />
FEA Distribution Assets: The major impact to FEA’s infrastructure was to distribution assets. An estimated 4,000km (41<br />
percent of FEA’s total distribution assets) were damaged by TC Winston. FEA line crews, international line crews and <strong>Fiji</strong><br />
contractors have been working to repair and restore connections to priority areas. Within four weeks of the disaster, 82<br />
percent of damaged distribution assets were restored in the Central Division, 40 percent were restored in the Western<br />
Division, 9 percent were restored in the Eastern Division and 100 percent were restored in the Northern Division. For<br />
customers whose houses were not destroyed, full restoration and connection is anticipated by June or July 2016. For<br />
the estimated 1,500 residential customers whose houses were destroyed, reconnection will take place progressively over<br />
88 Tropical Cyclone Winston, February 20, 2016
FIJI Post-Disaster Needs Assessment<br />
the next 12 months as reconstruction proceeds. In addition, the FEA communications network also sustained significant<br />
damage to assets, including to fibre-optic cables, repeater sites and roof-mounted antennas in substations.<br />
DoE Rural Power Systems: Approximately 54 rural diesel mini-grids were damaged and 609 solar home systems were<br />
destroyed. Reconstruction of diesel mini-grids and solar assets had not yet commenced when this PDNA was prepared.<br />
Cost estimates for damage are detailed in Table 61.<br />
Table 61: Estimated Cost of Damage in the Power Sector by Asset (F$)<br />
Asset (type of damage)<br />
FEA Generation Assets<br />
Cost estimate<br />
Wailoa Power Station (water damage) 60,000<br />
Vuda Power Station (building structure and generators) 40,000<br />
Levuka Power Station (building structure and generators) 130,000<br />
Nadarivatu Camp Site (building structures) 1,300,000<br />
Nagado Power Station (building structure and generators) 25,000<br />
Rakiraki Power Station (building structure and generators) 65,000<br />
FEA Transmission Assets (33kV, 132kV)<br />
132kV transmission networks 4,800,000<br />
33kV transmission 300,000<br />
Zone substations and switching stations (building structures, fences and<br />
switchyard structures)<br />
FEA Distribution Assets (11kV/6.6kV/415V)<br />
985,000<br />
Central Division 2,000,000<br />
Eastern Division 600,000<br />
Western Division 14,000,000<br />
Northern Division 600,000<br />
FEA Retail Assets<br />
Customer electricity meters 200,000<br />
FEA Communications and Network<br />
Fibre-optic communications network and repeater stations 2,000,000<br />
FEA Buildings and Fleet<br />
Property 70,000<br />
DoE Power Systems<br />
Diesel mini-grids (54 systems) 4,202,000<br />
Solar installations (609 systems) 1,589,000<br />
Total (F$ million) 33.0<br />
Source: <strong>Fiji</strong> Electricity Authority; Department of Energy.<br />
Losses to the Electricity Sector (F$8 million)<br />
TC Winston disrupted all of FEA’s power systems on Saturday, February 20, 2016. Electricity supply restoration commenced<br />
on Sunday, February 21. Power was restored to an estimated 1.55 percent of FEA’s customers within 24 hours, and within<br />
four weeks, an estimated 90.1 percent of the pre-cyclone demand was being supplied to the grid. Full reconnection to<br />
customers is anticipated by June or July 2016. Losses to FEA and DoE from TC Winston include:<br />
<br />
<br />
<br />
full reconnection is anticipated) due to damage to the electricity distribution network.<br />
<br />
2016, and March 30, 2016.<br />
Total FEA and DoE losses are estimated at F$8.1 million. A breakdown of the losses is presented in Table 62.<br />
Tropical Cyclone Winston, February 20, 2016<br />
89
FIJI Post-Disaster Needs Assessment<br />
Table 62: Estimated Losses in the Electricity Sector (F$)<br />
Cost Estimate<br />
FEA loss of revenue from disconnected customers 3,530,479<br />
Medium-term loss of revenue from an estimated 1,500 customers whose houses have been destroyed 40,000<br />
Higher operational costs from temporary reliance on diesel backup 4,500,000<br />
DoE loss of revenue from solar home systems 50,000<br />
Total 8,120,479<br />
Source: <strong>Fiji</strong> Electricity Authority; Department of Energy.<br />
Social Impact of Damage and Losses<br />
In light of the increasing use of firewood, especially in rural areas (where firewood is used by 77 percent of the population), 106<br />
the abundance of firewood left by the cyclone (from downed trees) probably represents a gain for households. For women,<br />
who typically are responsible for gathering firewood, the cyclone reduced the time needed for that chore. (Women who were<br />
interviewed confirmed this benefit.) However, the impact of the cyclone on electricity supply has substantially increased the<br />
amount of time women spend doing laundry, both in rural and urban settings. In some areas, women will continue to face<br />
these challenges until mid-year, when FEA anticipates full reconnection at the household level. Baseline data on washing<br />
machine use at the household level suggest a washing machine penetration rate of 70 percent. 107 Because washing must<br />
now be done manually, time allocated for laundry has increased from about 30 minutes a week to around three hours<br />
a week. Lack of electricity combined with disruptions in water supply has increased the domestic work burden and left<br />
women with very limited time for income-generating activities.<br />
In addition to affecting women’s household burden, lack of electricity also affects women’s opportunities for social and<br />
economic advancement. Electricity provides the mechanical power that women use for agricultural food processing,<br />
cooking, lighting, refrigeration, communications and commercial enterprises, while minimising the time expended on<br />
domestic work. Electricity supply disruptions have, therefore, undermined women’s ability to derive livelihoods that depend<br />
on electricity (for example, rural economic activities, such as virgin coconut oil production).<br />
Less visible perhaps is the impact of electricity on women’s and girls’ safety and sense of security. Following TC Winston,<br />
women and girls reported feeling insecure about going to sleep at night. 108 Lighting is a good deterrent to violence and its<br />
absence could put women at heightened risk.<br />
Speedy restoration of electricity is essential for the return of power-dependent livelihoods and safety. In terms of helping<br />
communities prepare for future cyclones, training men and women in securing their solar panels and equipment ahead of<br />
impending cyclones would be beneficial.<br />
Recovery and Reconstruction Needs for the Electricity Sector (F$34 million)<br />
Total recovery and reconstruction costs for the electricity sector have been estimated at F$33.8 million (Table 63). Recovery<br />
needs include:<br />
<br />
<br />
<br />
<br />
<br />
<br />
Table 63: Total Recovery and Reconstruction Needs for the Electricity Sector (F$ million)<br />
Recovery Reconstruction Resilience Total<br />
Generation 1.8 1.8<br />
Transmission 6.7 6.7<br />
Distribution and Retail 17.4 17.4<br />
Communications 2.0 2.0<br />
106<br />
<strong>Fiji</strong> Bureau of Statistics, Household Income and Employment Survey, 2008/2009.<br />
107<br />
Between 2002 and 2008, household-level washing machine usage increased from 15 percent to 31 percent. Assuming the same rate of<br />
increase, household-level washing machine usage is now at 70 percent.<br />
108<br />
“<strong>Fiji</strong> Gender Based Violence Sub-Cluster Key Advocacy Note,” April 9, 2016.<br />
90 Tropical Cyclone Winston, February 20, 2016
FIJI Post-Disaster Needs Assessment<br />
Recovery Reconstruction Resilience Total<br />
Property 0.1 0.1<br />
Rural Mini Grids and Stand-Alone Solar Systems 5.8 5.8<br />
Total 2.1 25.9 5.8 33.8<br />
Source: Estimations by Assessment Team.<br />
Note: A detailed breakdown of recovery needs by sector is included in Annex 2.<br />
Disaster Resilience in the Power Sector<br />
In order to improve system resilience, FEA and DoE will increase the cyclone design specification rating for key assets<br />
during medium-term reconstruction, which will include increased ratings for 132kV lattice towers, distribution lines, power<br />
plant housing structures and solar systems.<br />
Undergrounding key sub-transmission and distribution lines is one approach to improving resilience to cyclone events. FEA<br />
and DoE have already implemented this practice where deemed feasible. Currently, FEA has the following underground<br />
reticulation:<br />
<br />
<br />
<br />
<br />
Reconstruction following TC Winston will not include any additional immediate undergrounding of sub-transmission and<br />
distribution assets. However, FEA and DoE will continue to include undergrounding in future development plans to maximise<br />
system resilience.<br />
Examples of other opportunities to strengthen the resilience of diesel systems could include consideration of the following:<br />
<br />
<br />
<br />
ground, which could prevent damage to the powerhouses themselves and guard against the inundation of diesel<br />
generators. However, this approach will require longer mains cables from the powerhouses and, hence, will incur a<br />
greater initial cost. Burying cables from generation sources (diesel or solar) will also increase costs.<br />
<br />
systems. The design of renewable plant components would need to be engineered for Category 5 winds as these<br />
systems are more exposed than traditional diesel schemes. Solar components mounted on structures would need<br />
to be easily dismountable for safe storage (like the FEA wind turbines in Butoni, Sigatoka, which are lowered and<br />
secured in the event of a cyclone warning).<br />
3.3.4 Communications<br />
Summary<br />
Total damage and loss to the communication sector following TC Winston totaled around F$53.2 million, with the worst<br />
impacts occurring in the Western, Eastern and Northern Divisions. While overall impact in the Central Division was minimal,<br />
damage were sustained to key infrastructure connecting central Viti Levu with Vanua Levu and the Eastern Division, which<br />
resulted in significant service disruption and network downtime throughout these areas. There was minimal damage to<br />
postal services, while communications networks experienced the worst damage across the sector. Transmission towers in<br />
Koro, Vanua Balavu, Taveuni and parts of western Viti Levu were partly or totally destroyed, and transmission equipment in<br />
all four divisions was affected, resulting in a temporary loss of cellular, fixed-line, radio and TV services. Damage sustained<br />
in the worst-affected areas is expected to result in fixed-line, cellular and broadcast service disruptions until June or July<br />
2016.<br />
Total losses throughout all four divisions are estimated at F$22 million, are the result of main network disruptions due to<br />
power outages and include additional operating costs (fuel for generators, logistics, personnel, etc.) for temporary system<br />
repair and restoration. An estimated F$48.8 million is needed for the full recovery and reconstruction of the sector. While the<br />
majority of this amount will be privately funded, the government is also willing to assist the private sector in BBB, particularly<br />
for critical infrastructure that connects urban areas with rural and remote areas.<br />
Communications Sector Background<br />
The contribution of the communications sector toward GDP averaged 6.4 percent from 2007 to 2014. Deregulation in<br />
2008 paved the way for increased competition, reduced prices and significant growth in the sector. Currently, wired and<br />
Tropical Cyclone Winston, February 20, 2016<br />
91
Damage to South Ridge communications tower on Viti Levu<br />
Source: Chris Wensley/ADB<br />
wireless networks cover approximately 95 percent of the population. Due to improved network coverage and competitive<br />
pricing, mobile phone subscriptions have increased by 7.9 percent annually from 2007 to 2015, with the total number of<br />
subscribers reaching 965,950 by the end of the period. Landline usage has fallen in recent years as mobile phone usage<br />
has grown, and fixed telephone subscriptions per 100 people fell from 14.6 in 2007 to 8.4 in 2014. Household penetration<br />
of Internet broadband increased from 7.1 percent in 2007 to 30.7 percent in 2014, while the percent of individuals with<br />
Internet access rose from 10.9 percent to 41.8 percent over the same period, with 36.7 percent of households owning<br />
computers. Household expenditures on communications have risen steadily over the last decade. The proportion of<br />
household nonfood expenditure on communications rose from 4.3 percent in 2002/2003 to 5.4 percent in 2008/2009,<br />
reflecting the rapid rise in the number of mobile subscribers and the increasing importance of communications in the lives<br />
of all <strong>Fiji</strong>ans. 109<br />
<strong>Fiji</strong>’s communications sector comprises a mix of public and private corporations, including: Telecom <strong>Fiji</strong> Limited (TFL),<br />
which is the sole provider of local and long-distance fixed-line telephone services; <strong>Fiji</strong> International Telecommunications;<br />
two mobile service operators, Vodafone and Digicel (which also offer mobile Internet services); two broadband service<br />
providers (Connect and Unwired); and a number of information and communication technology (ICT) support services.<br />
Private broadcasters include Communications <strong>Fiji</strong> Ltd., MaiTV and <strong>Fiji</strong> TV, with <strong>Fiji</strong> Broadcasting Corporation Ltd., the<br />
sole state-owned broadcaster. Government direct investment in the sector includes the establishment of 26 Government<br />
Community Telecentres that enable remote communities to access educational resources, information, public services,<br />
and business products and services on the Internet. Post <strong>Fiji</strong> Ltd., a state-owned enterprise, provides national letter and<br />
parcel services, and several national and international companies provide courier services.<br />
The domestic ICT infrastructure includes extensive copper and fibre-optic cable networks that cover most urban and rural<br />
areas in Viti Levu and Vanua Levu, although some places remain without telecommunications coverage. Both TFL and<br />
FEA have invested substantially in underground fibre-optic cable networks. Mobile network operators rely largely on radio<br />
communications between cell towers and base stations, and approximately 1,399 base stations are located throughout<br />
<strong>Fiji</strong>. Table 64 shows the pre-disaster asset valuation for the sector.<br />
109<br />
Data are from the <strong>Fiji</strong> Bureau of Statistics.<br />
92 Tropical Cyclone Winston, February 20, 2016
FIJI Post-Disaster Needs Assessment<br />
Table 64: Pre-Disaster Asset Valuation of the Communications Sector (F$ million)<br />
Items<br />
Postal<br />
services<br />
Land-based<br />
systems<br />
Cellular<br />
systems<br />
Other<br />
systems<br />
Land 0.0 9.0 1.4 5.2 15.6<br />
Nonresidential building 6.1 6.4 0.0 0.0 12.5<br />
Residential building 0.0 0.2 1.7 4.8 6.7<br />
Plant and machinery 0.4 96.2 146.5 36.6 279.7<br />
Furniture, fixtures and office equipment 0.2 1.2 8.6 1.0 11.0<br />
Other office equipment 0.3 0.0 0.0 0.1 0.4<br />
ICT equipment 0.0 4.3 84.4 5.0 93.7<br />
Transport vehicles and related equipment 0.3 0.1 1.4 0.5 2.3<br />
Research and development 0.0 0.0 0.0 0.0 0.0<br />
Valuables (antiques, original art, precious metals, etc.) 0.0 0.0 0.0 0.0 0.0<br />
Other (subscriber, trunk exchange, exchange plant,<br />
intangibles, access, etc.)<br />
Total<br />
0.0 3.1 0.0 0.0 3.1<br />
Total 7.3 120.5 244.0 53.2 425.0<br />
Source: <strong>Fiji</strong> Bureau of Statistics (adjusted to 2015 values).<br />
Assessment of Disaster Effects on the Communications Sector (F$53 million)<br />
Damage to the Communications Sector (F$31 million)<br />
Postal, land-based, cellular and broadcast services were all disrupted by the cyclone, because both infrastructure was<br />
damaged and electricity was knocked out (damage and losses to the energy sector are discussed in Chapter 3.3.3 of this<br />
PDNA). Total damage to postal services was minimal, consisting mostly of damage to premises, equipment, parcels and<br />
supplies in the Suva, Nabouwalu, Koro and Lomaloma post offices. Damage to land-based systems affected approximately<br />
8,000 customers, mainly in the Western and Eastern Divisions. Major damage to the sector was estimated at F$31.2<br />
million, and comprised of costs for restoring services, infrastructure and equipment.<br />
In the Central Division, considerable damage was done to the South Ridge broadcast tower, which is owned by TFL and<br />
leased to broadcast and mobile operators. The tower provides a vital link to Vanua Levu, which accounts for about 30<br />
percent of <strong>Fiji</strong>’s economic activity. TFL sustained massive infrastructure damage, mostly in the north of Viti Levu (particularly<br />
the towers and radios linking Suva to Rakiraki and Lautoka via the South Ridge), and in the Northern and Eastern Divisions.<br />
As TFL lacks a complete fibre network around Viti Levu, damage to its towers and antennas disrupted the entire network<br />
from Viti Levu to Vanua Levu.<br />
Damage to cellular/mobile networks occurred in the Eastern, Central and Western Divisions. In Koro, Taveuni and Vanua<br />
Balavu in the east, and the Yasawa Islands in the west, critical link towers collapsed and ancillary equipment was damaged.<br />
Many of the damaged towers remain standing, but a significant number of dishes and other radio equipment were lost.<br />
Voice linkages have been restored, but data coverage remains limited.<br />
Losses to the Communications Sector (F$22 million)<br />
The telecommunications sector sustained around F$22 million in losses throughout all four divisions. These losses were<br />
the result of: main network disruptions due to electricity outages; additional operating costs relating to extra fuel for<br />
generators and to the transportation (helicopters, boats and personnel) involved in restoring and maintaining systems<br />
prior to reconstruction; and temporary facilities such as temporary towers and masts. For land-based systems, losses of<br />
approximately F$4 million are estimated for this year. Although cellular-based systems suffered initial loss of service and<br />
customer revenue for one to two weeks following the cyclone, the customer base has largely been restored.<br />
Table 65: Damage and Losses to the Communications Sector (F$ million)<br />
Items<br />
Damage<br />
Postal<br />
Services<br />
Land-based<br />
Systems<br />
Cellular<br />
Systems<br />
Other<br />
Systems<br />
Buildings, furnishings, plant and equipment 0.29 3.10 7.38 0.44 11.21<br />
ICT equipment, lines, antennas, towers and<br />
ancillary equipment<br />
Totals<br />
0.04 2.80 10.79 1.43 15.06<br />
Transport vehicles and related equipment 0.00 - - - 0.00<br />
Tropical Cyclone Winston, February 20, 2016<br />
93
FIJI Post-Disaster Needs Assessment<br />
Items<br />
94 Tropical Cyclone Winston, February 20, 2016<br />
Postal<br />
Services<br />
Land-based<br />
Systems<br />
Cellular<br />
Systems<br />
Other<br />
Systems<br />
Others 0.00 0.00 4.94 0.02 4.96<br />
Total damage 0.3 5.9 23.1 1.9 31.2<br />
Losses<br />
Lower revenues 0.87 4.00 4.13 9.64 18.64<br />
Higher operating costs 0.06 1.00 2.23 0.04 3.33<br />
Total losses 0.93 5.00 6.36 9.68 21.97<br />
Total Effects 1.3 10.9 29.5 11.8 53.2<br />
Source: Estimations by Assessment Team.<br />
Social Impact of Damage and Losses<br />
In the immediate aftermath of the cyclone, land-based systems were disrupted throughout all four divisions, with the worst<br />
impacts felt in the Northern, Eastern and Western Divisions, including parts of Ba and Rakiraki. Repairs in these areas<br />
were ongoing at the time of this PDNA. Services in the Central Division, in particular the Suva-Nausori corridor, suffered<br />
minimal disruption, and urgent repairs and maintenance to access networks in the Suva, Nausori, Nadi and Lautoka central<br />
business districts resulted in prompt restoration of service to these areas. In places where fallen telephone poles and wires<br />
are still being repaired, TFL is offering wireless devices free of charge to customers who wish to use fixed-line services.<br />
Customer uptake has been minimal, however, with interest in the offer mainly coming from business customers.<br />
Cellular network coverage for the country was partially restored within a few days of the disaster, but about 30 to 50<br />
percent of sites are still operating on generators due to limited electricity supply. Full cellular network restoration is expected<br />
sometime between April and July 2016. Broadcasters suffered extensive infrastructure damage in Ba, Tavua and Rakiraki<br />
and, as a result, most TV and radio services will likely remain disrupted until April or May 2016.<br />
Recovery and Reconstruction Needs for the Communications Sector (F$50 million)<br />
A BBB approach is critical for sustainability of the communications sector. The extent of the damage and losses incurred,<br />
and the expected socioeconomic impact of prolonged service disruption in rural and remote areas, underscore the need<br />
for building more resilient infrastructure that can withstand future disasters.<br />
In order for the communications sector to recover in the short term, an estimated F$24,000 is needed to establish temporary<br />
wireless communications for businesses in the worst-affected areas, particularly in parts of Ba, Rakiraki and the Eastern<br />
Division, where TFL fixed-line access networks were still under repair at the time of this PDNA.<br />
Total recovery needs of F$48.8 million are required. Medium- to long-term reconstruction activities for TV and radio broadcast<br />
systems will include investing in Category 4 cyclone-resistant bunkers to house transmission equipment. For land-based<br />
systems, this will involve completing the fibre ring around Viti Levu (approximately 100km remain from Korovou to Rakiraki)<br />
and building a second redundant link from Viti Levu to Vanua Levu through Lomaiviti, which will provide resiliency to Vanua<br />
Levu, Taveuni, Levuka and Lakeba and backhaul to other islands. For cellular systems, damaged transmission towers and<br />
equipment will need to be rebuilt to Category 3 and 4 specifications, particularly in rural and remote sites. However, given<br />
their low return on investment, towers and masts in rural areas are generally constructed using low-cost, poor-quality,<br />
locally fabricated materials.<br />
In this regard, the government is committed to assisting the private sector in building back more disaster-resilient<br />
infrastructure through public-private partnerships and infrastructure-sharing arrangements. The medium- to long-term<br />
reconstruction activities identified through this PDNA for the communications sector are consistent with the long-term<br />
strategic direction of the government’s five- and 20-year national development plans, which aim to boost the rural economy<br />
through better rural infrastructure, connectivity and service delivery.<br />
Table 66: Total Recovery and Reconstruction Needs for the Communications Sector (F$ million)<br />
Replacement, repairs and maintenance of damaged stock,<br />
infrastructure and equipment<br />
Totals<br />
Recovery Reconstruction Resilience Total<br />
1.9 29.4 0.0 31.3<br />
Urgent rehabilitation of communication towers and equipment 4.5 0.0 0.0 4.5<br />
Strengthening resilience of communications system 0.0 0.0 13.0 13.0<br />
Total 6.4 29.4 13.0 48.8<br />
Source: Estimations by Assessment Team.<br />
Note: A detailed breakdown of recovery needs by sector is included in Annex 2.
Damage to Namena Island<br />
Source: Sangeeta Mangubhai/Wildlife Conservation Society<br />
3.4 Cross-Cutting Issues<br />
3.4.1 Environment<br />
Summary<br />
<strong>Fiji</strong>’s environment sustained substantial damage in the aftermath of TC Winston, directly affecting people’s daily lives,<br />
livelihoods, subsistence and economic activities. Damage were largely due to strong devastating winds and the occurrence<br />
of storm surges in coastal areas. The major environmental assets that were affected include native forests, mangroves and<br />
coral reefs. In total, 47 percent of native forests, 67 percent of mangroves and 79 percent of coral reefs in <strong>Fiji</strong> are within a<br />
50km radius of the cyclone’s path.<br />
Losses from waste management<br />
created as a result of cyclone , 0%<br />
Damage to<br />
native forest,<br />
F$86m<br />
Damage to<br />
coral reefs,<br />
F$119m<br />
Figure 30: Damage to Major Environmental Assets (F$ million)<br />
Source: Estimations by Assessment Team.<br />
Losses from waste management created as a result of cyclone<br />
Damage to coral reefs<br />
Damage to mangrove forest<br />
Damage to native forest<br />
Damage to<br />
mangrove forest,<br />
F$27m<br />
Tropical Cyclone Winston, February 20, 2016<br />
95
FIJI Post-Disaster Needs Assessment<br />
Available literature was used to calculate the economic valuation of ecosystem services in the cyclone-affected area and,<br />
thus, estimate the damage and losses caused by TC Winston. The total value of damage to environmental assets is<br />
approximately F$233 million of which 51 percent is damage to coral reefs, 37 percent to native forests and 12 percent to<br />
mangroves. The total value of losses for these three environmental assets is approximately F$630 million. 110 Total recovery<br />
needs are around F$61 million, while reconstruction needs are approximately F$13 million.<br />
Environment Sector Background<br />
<strong>Fiji</strong> has a range of ecosystems, including seagrass beds, coral reefs, mangroves, wetlands, tropical forests and grasslands.<br />
Native forests, mangroves and coral reefs cover 1,423,280 hectares (ha) of land and coastal area.<br />
600000<br />
500000<br />
Assets in affected areas cyclone<br />
Assets in non affected areas<br />
400000<br />
Hectares<br />
300000<br />
200000<br />
100000<br />
0<br />
Native Forest<br />
Figure 31: Hectares of Assets in Affected Areas<br />
Source: Estimations by Assessment Team.<br />
Mangrove<br />
Assest Type<br />
Coral reefs<br />
Native Forests cover about 969,050 ha of land, of which 47 percent is in cyclone-affected provinces. Only a small<br />
percentage (approximately 2.7 percent or 43,000 ha) is currently in protected areas with another 57,000 ha proposed for<br />
conservation/protection (National Environment Council-IP Report; Olson et al., 2010; <strong>Fiji</strong> Biodiversity Strategy and Action<br />
Plan, 2007). Dry forests are among the most critically endangered forest types. Multiple pressures have degraded the<br />
condition of forests, including illegal logging, unsustainable harvesting of timber by traditional landholders, clearance for<br />
agriculture, collection of firewood, and invasive vine and tree species, particularly African tulip.<br />
Mangroves cover 54,190 ha of coastal areas, of which 67 percent are in cyclone-affected provinces. The major pressures<br />
on mangrove forests are illegal logging and fuelwood collection, which led to around a 25 percent loss of total mangrove<br />
area from 2003 to 2013 (MACBIO, 2016).<br />
Coral Reefs cover approximately 454,000 ha of nearshore and marine areas in <strong>Fiji</strong>. Of these, almost 80 percent is within<br />
a 50km radius from the cyclone’s path. Almost 17 percent of coral reefs are under conservation and local protection, an<br />
increase from 12 percent in 2010. This resulted from the decision by local communities to establish the <strong>Fiji</strong> Locally Managed<br />
Marine Area.<br />
Assessment of Disaster Effects on the Environment (F$862 million)<br />
The combined damage and losses for the environment sector amount to F$862 million, of which F$233 million is attributable<br />
to damage, F$595 million are losses from ecosystem assets and F$34 million is attributable to losses generated by waste<br />
management requirements following TC Winston.<br />
Damage to the Environment (F$232 million)<br />
For native forests and mangroves, damage included fallen trees and extensive loss of foliage stripped by the cyclone. For<br />
coral reefs, damage included uprooting of hard corals, and extensive death of fish and other marine life (see Box 1). Total<br />
damage is F$232 million, with the majority of this attributable to coral reef damage.<br />
110<br />
This figure includes a recovery timeframe that is aligned with the recovery periods considered for other sectors within this PDNA.<br />
However, the recovery period for the environment sector could stretch to 10 years for coral reefs and 15 years for native forests and<br />
mangroves; therefore, total losses may be higher than those reflected in this report.<br />
96 Tropical Cyclone Winston, February 20, 2016
FIJI Post-Disaster Needs Assessment<br />
Figure 32: Distribution of Mangroves and Coral Reefs in Cyclone-Affected Provinces<br />
Source: Estimations by Assessment Team.<br />
Losses to the Environment (F$630 million)<br />
The native forests and mangroves that were damaged by the cyclone are expected to take at least 15 years to deliver the<br />
same quality of ecosystem services than before the cyclone. Coral reefs are expected to take about 10 years to recover fully<br />
if intervention through structural restoration is undertaken, assuming no additional pressures from development activities.<br />
For the purposes of this report, the values of ecosystem services lost over a shorter timeframe more aligned with the<br />
recovery period for other sectors were used. The calculated losses are estimated to be F$629 million of which F$595 million<br />
are from ecosystem assets and the remainder are from the cost of disposal of debris and green vegetation generated by<br />
the damaged and destroyed buildings, as well as crops and trees in agricultural land. It was assumed that there would<br />
not be clearance of logs or salvage logging in native forests or mangroves. Most of these losses will be borne by traditional<br />
land holders and the government.<br />
Table 67: Total Damage and Losses to the Environment Sector (F$ million)<br />
Ecosystem Assets Damage Losses a Total Private Public<br />
Native forest 86 225 311 100<br />
Mangroves 27 66 93 100<br />
Coral reefs 119 304 423 100<br />
Losses from waste management created as a<br />
34 34 100<br />
result of TC Winston b<br />
Total 232 629 861<br />
Source: Estimations by Assessment Team.<br />
a.<br />
Estimation of environmental losses include ecosystem service losses for 2016-18 for native forests, mangroves and coral reefs.<br />
b.<br />
Includes the disposal of the damaged/uprooted trees and crops from agricultural areas (green waste) and building debris resulting from<br />
damage caused by TC Winston to housing, schools and other buildings, and damage to waste management facilities that must cope with<br />
this waste. Some hazardous waste (approximately 5 percent of the total waste stream) includes treated pine and a limited amount of<br />
asbestos material. No information currently exists on landfill capacity, but such information must be considered as part of the recovery<br />
effort. In addition, mud and silt that were deposited are not included, as this was cleared as part of the emergency cleanup effort.<br />
Tropical Cyclone Winston, February 20, 2016<br />
97
FIJI Post-Disaster Needs Assessment<br />
The distribution of losses (F$ million) for each division is shown in Figure 33.<br />
300<br />
250<br />
Losses (F$ million)<br />
200<br />
150<br />
100<br />
50<br />
0<br />
Western Western Western Western<br />
Figure 33: Losses to the Environment Sector by Division<br />
Source: Estimations by Assessment Team.<br />
Native forests Mangrove Coral reefs<br />
Social Impact of Damage and Losses<br />
Damage to the ecosystem and the services it provides is already affecting people (Box 1), and the impacts are likely to<br />
continue for at least a decade. Recovery efforts are aimed at reducing the timeframes of these impacts while supporting<br />
the recovery of ecosystem services and meeting some of the livelihood needs.<br />
Box 1: Damage to Reef: Changing lives and livelihoods of people<br />
The village of Namatala in Ra Province is a small typical coastal village with 24 households and 114 people that rely on fishing for their<br />
protein and cash income. TC Winston brought a lot of changes; the channels used to canoe through are now peppered with one<br />
metre tall “boulders” of coral, deposited by the storm surge generated by the cyclone. One of these boulders is 20m by 3m and has<br />
formed an island of dead coral mixed with shells unknown to people in the village, although they suspect these were lifted from deep<br />
waters. Half of the coral reef that is home to the fish they catch is damaged; coastline that was previously fine sand is now littered with<br />
rocks and coral “boulders”; the deeper waters are shallower; and their two fishing grounds were completely destroyed. The routes<br />
to the fishing areas, which were so well known to the community that they could be traversed at night without fear, have drastically<br />
changed. Following TC Winston, sea cucumbers, eels and other fish lay dead on the beaches, floated on the surface of the water and<br />
were deposited deep into the mangrove areas. The lives and the livelihoods of the people of Namatala village are now very uncertain.<br />
Recovery and Reconstruction Needs for the Environment (F$74 million)<br />
Total needs are estimated at F$73.9 million (Table 68). For effective recovery of environmental assets, a number of activities<br />
that build on ongoing programmes as well as some new ones are proposed and costed. Many of these translate into<br />
additional operational costs, such as those incurred in the management and control of invasive tree species like the African<br />
tulip. To enable coral reefs to rehabilitate and recover for the first two years, pressure on inshore fisheries must be reduced<br />
and interventions like the deployment of FADs will help provide alternative food and protein sources to communities. An<br />
ecological survey of damaged areas (for all environmental assets) and the sustained monitoring of information on the status<br />
of assets in the medium to long term are recommended. The establishment of a government centralized database to<br />
maintain and regularly update information and data is pivotal to recovery efforts and should be supported by community<br />
partners, NGOs and academia, where relevant.<br />
Interventions for clearing debris will differ in cities, villages and agricultural areas, both in terms of methodology and<br />
equipment needed. Special treatment for hazardous wastes is critical and must be supported accordingly.<br />
98 Tropical Cyclone Winston, February 20, 2016
FIJI Post-Disaster Needs Assessment<br />
Table 68: Total Recovery and Reconstruction Needs for the Environment Sector (F$ million)<br />
Increase operational cost to farmers to manage invasive tree<br />
species<br />
Strengthen and enforce planning and environmental legislative<br />
and institutional frameworks<br />
Recovery Reconstruction Resilience Total<br />
10.1 10.1<br />
5.0 5.0<br />
Provide operational funds for FADs 0.9 0.9<br />
Increase operational costs for the management of protected<br />
coral reef, mangrove and native forest reserves/national parks<br />
Increased cost of ecological surveys, damage assessment,<br />
monitoring and recovery of ecosystem asset and establishing<br />
a centralised database<br />
Clearance of debris in cities and villages (housing, green<br />
waste, etc.) and clearance of agricultural land<br />
Special treatment for potentially recyclable/reusable material<br />
and hazardous waste<br />
3.0 3.0<br />
8.2 8.2<br />
28.1 28.1<br />
5.5 5.5<br />
Replanting of mangroves 1.8 1.8<br />
Assisting recovery of coral reefs through transplants and<br />
protection<br />
Waste processing equipment (cost of compactor and<br />
shredders)<br />
4.7 4.7<br />
6.6 6.6<br />
Total 60.8 13.1 73.9<br />
Source: Estimations by Assessment Team.<br />
Note: A detailed breakdown of recovery needs by sector is included in Annex 2.<br />
In economic terms, damage and losses to ecosystems are extensive in the provinces affected by TC Winston. The monetary<br />
values reflect the richness of <strong>Fiji</strong>’s ecosystems and their importance to its people, livelihoods and the economy. The<br />
proposed and costed activities are aimed at supporting recovery of these ecosystems and are relatively modest compared<br />
to estimated losses. However, for the people and their livelihoods, the time that the ecosystems will need to recover will<br />
also mean continued socioeconomic impacts. Thus, ensuring that people’s needs are met through other support (such as<br />
FADs) is critical for guaranteeing that ecosystems are not placed under additional pressure and have time to recover and<br />
help meet the people’s needs in the near future.<br />
3.4.2 Gender and Social Inclusion<br />
Summary<br />
The impact of TC Winston will be felt along the social lines and disparities that exist within <strong>Fiji</strong>an society. Gender inequality<br />
is one of the determinants that has shaped not just who has been adversely affected by the disaster, but also who has the<br />
capacity to recover from it. It will also determine men’s and women’s participation in and benefit from recovery interventions<br />
and their general resilience to future disasters. Women, who make up about 49 percent of the <strong>Fiji</strong>an population, are the<br />
largest disadvantaged population that has been negatively affected by TC Winston. While men are overrepresented in<br />
waged on- and off-farm employment, the high burden of reproductive work confines women to the poorly remunerated<br />
informal sector, particularly subsistence agriculture, which leaves them with no income security to respond to the disaster.<br />
Yet women’s subsistence activities and earnings contribute directly to nutritional security and household economic welfare<br />
and foster human welfare. The impact of the cyclone on women may, therefore, result in increasing dependency on<br />
subsistence economic activity, increasing time poverty, deepening their poverty and widening gender inequality. While<br />
women have been disproportionately impacted by the cyclone, simply viewing them as victims only exacerbates their<br />
vulnerability. Instead, recognizing that they have knowledge, social capital and skills critical for recovery is important.<br />
Recovery interventions in housing and productive sectors present an opportunity to start redressing some of the inequalities<br />
that put women in a disadvantageous position. The gender gap of 34.9 percent points in labour force participation rates<br />
suggests significant opportunity to engage more women in recovery and reconstruction to rebuild their livelihoods, increase<br />
their asset base and achieve long-term resilience. Ensuring that no discrimination exists based on sex, age, ethnicity,<br />
sexual orientation or disability at all stages of the recovery process is also crucial.<br />
Tropical Cyclone Winston, February 20, 2016<br />
99
Southern Taveuni, Vuna village<br />
Source: Vlad Sokhin/World Bank<br />
Gender and Social Inclusion Background<br />
The <strong>Fiji</strong>an population is diverse in terms of gender, ethnicity, religion and economic status. Based on the <strong>Fiji</strong> 2007 census, 111<br />
females make up 49 percent of the population. The fertility rate per women is about 2.6 live births. <strong>Fiji</strong> has made some<br />
strides in achieving gender equality and lifting the status of <strong>Fiji</strong>an women and girls. <strong>Fiji</strong> ranks relatively high on the gender<br />
equality scale, at 87 out of 187 countries. 112 According to the HDI, 113 female life expectancy of 73.2 years is higher than that<br />
of men, which stands at 67.2 years. School enrolment for women at primary, secondary and tertiary levels is higher than for<br />
men. Progress has also been achieved in women’s participation in politics and public affairs. While <strong>Fiji</strong> still lags behind the<br />
global average of 21.9 percent, <strong>Fiji</strong>an women hold 14 percent of seats in parliament, higher than any other country in the<br />
Pacific. However, only 5 percent of permanent secretaries are female and 7.07 percent of board and committee members<br />
are women, 114 making it difficult for them to have a substantial voice in public policy formulation and implementation.<br />
Gender equality and women’s empowerment remain enormous challenges for the country. Women’s participation in the<br />
market labour force stands at 41.6 percent, more than 34 percent points lower than the male equivalent, which stands at<br />
75.8 percent. 115 Time poverty due to domestic work explains, to some extent, the high prevalence of women in the informal<br />
sector, which provides them with more flexible working hours. The 2010/2011 Employment and Unemployment Survey<br />
(EUS) analysis indicates that women in both urban and rural areas spend far more time on employment and housework than<br />
men. Women, who do 74 percent of all domestic work, spend 54.2 hours per week on unpaid employment, compared to<br />
32.3 hours for men. Violence against women and girls in <strong>Fiji</strong> is alarmingly high where 72 percent of ever-partnered women<br />
have experienced physical, sexual or emotional violence. An estimated 12 percent of households are headed by females 116<br />
and 4 percent of the <strong>Fiji</strong>an population is elderly (above the age of 65). The <strong>Fiji</strong>an ethnic structure comprises of iTaukei at 57<br />
percent of the population, Indo-<strong>Fiji</strong>ans (37 percent) and other ethnic groups (6 percent).<br />
111<br />
<strong>Fiji</strong> Bureau of Statistics: <strong>Fiji</strong> 2007 Population Census.<br />
112<br />
UNDP 2015: Human Development Report 2015.<br />
113<br />
Ibid.<br />
114<br />
Source: List of Board members, Ministry for Public Enterprise 2016. Unpublished data.<br />
115<br />
ILO 2016: <strong>Fiji</strong> Labour Market Update.<br />
116<br />
<strong>Fiji</strong> Bureau of Statistic 2011: Republic of <strong>Fiji</strong> Poverty Trends, Profiles and Small Area Estimation (Poverty maps) in Republic of <strong>Fiji</strong> (2003-<br />
2009).<br />
100 Tropical Cyclone Winston, February 20, 2016
FIJI Post-Disaster Needs Assessment<br />
13%<br />
Between 15 and 64 yrs years<br />
65 years and above<br />
Below 15 years<br />
50% 37%<br />
Figure 34: Death Rate among Different Age Groups<br />
Source: MoHMS.<br />
Assessment of Disaster Effects on Gender and Social Inclusion<br />
TC Winston affected approximately 540,400 people, including 264,000 women and girls, equivalent to 40 percent of <strong>Fiji</strong>’s<br />
population. A total of 44 people died from the cyclone. An analysis of 86 percent (38) of the deaths show some differences<br />
based on age and ethnicity. While the male population outnumbers females by 1.06 to 1, no real differences in mortality<br />
rates exist between females and males, which stand at 50 percent for each gender group. However, discrepancies exist<br />
among the age groups as shown in Figure 34.<br />
The widest discrepancy is among the elderly (above the age of 65 years), who make up 4 percent of the population but<br />
37 percent of deaths, which could be explained by their limited agility and physical strength to quickly move away from<br />
danger. The large discrepancies in the mortalities among the different racial groups require further analysis to inform the<br />
development of national DRM programmes and actions that reduce potential risks faced by different social groups. The<br />
iTaukei, which make up 57 percent of the population, 117 were overrepresented comprising 92 percent of the deaths.<br />
However, only three Indo-<strong>Fiji</strong>ans died from the disaster. Islands, such as Koro, where 21 percent of the deaths occurred, are<br />
largely iTaukei. However, even in affected districts where the proportion of the Indo-<strong>Fiji</strong>an population is larger, such as Ba<br />
(54 percent), the death rate among iTaukei was still disproportionally high. The largest affected population is concentrated in<br />
the Western Division (Table 7) which could result in increased economic hardship among Indo-<strong>Fiji</strong>ans who are concentrated<br />
in this division.<br />
Impact on the Social Sector<br />
Within the social sector, housing and shelter is the subsector most affected by the cyclone. A house is more than a<br />
home for women; it is also a vehicle for economic livelihoods. Consequently, destruction of houses, kitchens and other<br />
household assets have different consequences for women and men. For example, in Tailevu, in the Central Division,<br />
women have become severely disadvantaged in their ability to take care of homes and derive livelihoods, such as mat<br />
and basket weaving 118 due to the destruction of houses, kitchens, raw materials and household equipment. Housing also<br />
shelters women and young girls from potential violence. Based on experience from previous disasters, lack of shelter and<br />
privacy, and crowded living arrangements with extended family and friends, can lead to a heightened risk of violence to<br />
and exploitation of women and girls. Single women, the elderly, widows and widowers, and PLWD have been impacted<br />
the most. Their homes are often poorly constructed or maintained and are likely to have sustained extensive damage. Lack<br />
of physical strength and/or financial resources will leave these households with severe challenges in quickly rebuilding<br />
homes. As the allocated F$70 million may be inadequate to reach all households that earn less than F$50,000 a year, it<br />
will be essential that the government’s Help for Homes initiative targets the most vulnerable households as beneficiaries.<br />
Both women and men must participate in and benefit from home reconstruction programmes. As such, targeted training in<br />
masonry and building skills to support the home construction programme could assist women, who are underrepresented<br />
in the labour force, to augment their livelihoods. Issues relating to land tenure and ownership rights must be addressed to<br />
ensure that housing recovery does not reinforce inequality in access to land by disadvantaged groups.<br />
The extensive destruction of agricultural produce could have serious repercussions on the nutrition and health of the<br />
affected population in the short and long term. The MoHMS is already recording an increase in malnutrition among children<br />
in places like Koro. As families struggle to meet competing basic needs with reduced incomes, some of the coping<br />
mechanisms may include reductions in both quantity and nutritional value, affecting the health of children, and pregnant or<br />
lactating women. Sustained surveillance of nutrition status among children, pregnant women and lactating mothers and<br />
response are essential. Households employ different, sometimes negative, coping mechanisms in response to disasters.<br />
117<br />
Based on 2007 Census data.<br />
118<br />
Based on interviews conducted by the Department of Social Protection, ILO, UN Women and UNDP on 13 April 2016.<br />
Tropical Cyclone Winston, February 20, 2016<br />
101
FIJI Post-Disaster Needs Assessment<br />
As was the case in the 2012 floods, anecdotal reports suggest that women and girls are offering sex in exchange for<br />
food. 119 In light of this, reproductive health services and outreach should, therefore, be strengthened to provide information<br />
and services on maternal health, sexual violence and adolescent sexual reproductive health. With regard to education, the<br />
projected decrease in economic output attributable to TC Winston could impact school enrolment. In response to trauma<br />
among children following the disaster, school programmes should continue to provide psychosocial support to children in<br />
order to reduce the long-term impact of psychological distress.<br />
Impact on the Productive Sector<br />
From a gender perspective, an analysis of the whole productive sector indicates that women lost a total of about F$120<br />
million in personal income loss (Table 69) as a result of the disaster, which is less than income losses incurred by men. This<br />
is because less women than men are employed. However, women are poorer, earn less income, are more dependent on<br />
subsistence economies, and, therefore, have fewer options to cope with the disaster impact than their male counterparts.<br />
Agriculture is an important form of employment for rural communities. Women hold a 33 percent share of the sector, 120<br />
and losses in personal income due to TC Winston for women employed in the agriculture sector total F$99 million. This<br />
economic impact could have profound consequences at the household level as women’s meager income is usually<br />
invested in food, nutrition and familial basic needs, and, hence, overall household wellbeing and economic advancement<br />
could be impacted.<br />
Table 69: Personal Income Losses Borne by Men and Women by Productive Sector and Transport Sector<br />
Sector Women’s share by sector (percentage) Personal income losses (F$ million)<br />
102 Tropical Cyclone Winston, February 20, 2016<br />
Total Men Women<br />
Agriculture 0.33 298.2 198.9 99.3<br />
Commerce 0.43 17.2 9.8 7.4<br />
Manufacturing 0.31 18.5 12.8 5.7<br />
Tourism 0.42 17.0 9.9 7.1<br />
Transport a 0.11 0.7 0.6 0.1<br />
Total 0.32 351.6 232.0 119.6<br />
Source: Estimations by Assessment Team.<br />
Extensive damage to and production loss of small livestock in general and damage to vegetables in the Western Division,<br />
resources normally under the control of women, have depleted women’s asset base and deprived them of key protein<br />
sources and extra income, leaving them vulnerable to economic hardship. Furthermore, agricultural production losses,<br />
especially in fisheries, are expected to last close to a decade. Rural women’s income will, therefore, remain depressed over<br />
a long period of time and, thus, rural women may require income and food assistance for a long time. Beyond agriculture,<br />
commerce and tourism, small and micro enterprises provide significant employment to <strong>Fiji</strong>ans. The proportion of women in<br />
the informal sector is large, especially in SMEs and trading. While the low entry capital requirement and the flexible hours<br />
allow engagement in the sector and meeting reproductive obligations, the informality of the sector also leaves women with<br />
limited social protection to cope with the impacts, unlike paid workers. Most micro-enterprises in the affected areas are<br />
agro-based, comprised mainly of food processing, handicrafts and weaving. Damage to homes, raw materials and raw<br />
materials processing equipment, transport disruptions and depressed markets 121 have affected the ability of both men and<br />
women to derive livelihoods. Worse still, savings needed to restore their businesses will be diverted towards meeting basic<br />
household and home reconstruction needs. Soft loans and medium- and long-term skills development and direct access<br />
to external markets are also needed for women entrepreneurs to restart their businesses, reduce their reliance on local<br />
tourist markets and enhance their resilience against future disasters.<br />
In general, the combination of lost income, dependence on subsistence farming, constraints in mobility for other job<br />
options, limited access to finance and increased reproductive responsibilities will increase women’s economic hardship<br />
and dependence. Taking into account women’s large contribution to the informal sector and the constraints they face in<br />
recovery, efforts should be made to ensure that recovery programmes do not contribute to greater gender inequalities and<br />
increased poverty for women. Targeted investment in women should be an integral part of all recovery strategies in the<br />
productive sectors. Policies that seek to reduce the dependence of women on the natural resource base and proactively<br />
address the underlying drivers that make women more impoverished than men are essential. Affirmative action should<br />
be implemented to ensure the participation and benefit to women in reconstruction programmes. Skills development in<br />
entrepreneurship and masonry combined with market development will be important in reducing women’s dependence on<br />
agriculture and building their resilience against future disasters.<br />
119<br />
Based on the Gender Based Violence Sub-Cluster Advocacy Note: Gender-Based Violence in the Aftermath of the <strong>Fiji</strong> Tropical Cyclone<br />
Winston.<br />
120<br />
ADB 2015: <strong>Fiji</strong> Country Gender Assessment.<br />
121<br />
Based on interviews with women handcraft sellers in Lautoka.
FIJI Post-Disaster Needs Assessment<br />
One aspect that effectively limits and slows women’s post-disaster recovery and economic growth is time poverty, which<br />
can perpetuate gender inequalities, where women burdened by domestic work lag behind men who have more time to<br />
engage in other income-generating activities and, thereby, recover more quickly. According to the 2010-2011 EUS, women<br />
and girls spend 23 hours per week on reproductive work, 15 hours more than men. As noted below, women are spending a<br />
longer time securing water and doing laundry, and a combination of reduced agriculture yields and cessation of food rations<br />
will increase the time necessary for gleaning food. While ensuring that women actively participate in community recovery<br />
programmes is important, such engagement should consider gender disparities in time use and the unequal distribution of<br />
unpaid work between women and men and, therefore, avoid increasing women’s burden of further work. To enable women<br />
to participate in recovery and reconstruction programmes, the provision of childcare will be essential.<br />
Impact on Infrastructure and Physical Assets<br />
The largest impact of the damage to infrastructure has been changes in time use by women and girls, especially in areas<br />
that still continue to experience electricity and water supply cuts, which have increased the time necessary for fetching<br />
clean water and doing laundry. For example, a high prevalence of washing machines 122 in urban and rural areas has meant<br />
that power cuts increased laundry time from half an hour to three hours per week. In addition, time and labour expended in<br />
meeting water household needs has increased from zero to three hours a week. The disruptions have curtailed the ability of<br />
women and girls to engage in other productive and income-generating activities, since access to electricity affords women<br />
the opportunity for social and economic advancement, and provides mechanical power for agricultural food processing,<br />
cooking, lighting, refrigeration, communications and commercial enterprises, while minimising the time spent on domestic<br />
work. Disruptions in electricity supply have, therefore, undermined women’s ability to derive electricity-dependent livelihoods<br />
(e.g., virgin coconut oil production). Less obvious, perhaps, is the impact of electricity on women’s and girls’ safety and<br />
sense of security, 123 since lighting is a deterrent of violence and its absence puts women at a heightened risk. Thus, speedy<br />
electricity restoration is essential for the return of power-dependent livelihoods and women’s safety.<br />
Protection Issues 124<br />
Sexual and Gender-Based Violence (SGBV): Violence against women in <strong>Fiji</strong> is alarmingly high, with 72 percent of everpartnered<br />
women experiencing physical, sexual or emotional violence at some point. 125 Intimate partner violence against<br />
women imposes a high burden of injury on women and the economy. Each day, approximately, 43 women are injured, 16<br />
are injured badly enough to need health care and one is permanently disabled. 126 While data on gender-based violence<br />
in the context of TC Winston is limited, we know from previous emergencies, including the 2012 <strong>Fiji</strong> floods, that sexual<br />
violence against women and girls was reported in evacuation centres and domestic violence increased due to the additional<br />
stress during crisis. Reports from the field indicate women feeling unsafe in some locations, including evacuation centres,<br />
and an increase in the use and abuse of alcohol by men as a coping mechanism, putting women and children at further risk<br />
of harm. Some women have reported feeling scared to sleep at night, and have reported increasing sexual harassment. 127<br />
Similar to other disasters in <strong>Fiji</strong>, there are increased reports of domestic violence, in particular to the <strong>Fiji</strong> Women Crisis<br />
Centre. Violence, exploitation and abuse of children are heightened risks as community protection mechanisms are<br />
disrupted and populations are displaced and under distress. This is further exacerbated by extensive destruction of homes,<br />
which may leave women and girls living with relatives and extended families or living in unsecured homes. Female-headed<br />
households may be at a greater risk due to lack of male protection. Furthermore, reduced availability of food and a decline<br />
in living conditions both increase affected populations’ exposure to sexual exploitation and abuse, including engagement in<br />
negative coping mechanisms in order to survive. For example, women and girls have already reported requests from men<br />
for sexual favors in exchange for food and other supplies.<br />
Recovery interventions should increase access to reproductive health care, scale up the presence of specific services,<br />
including clinical care for physical and sexual assault, and actively seek women’s views on how to improve safety and<br />
security in affected communities. Strengthened grievance and referral systems and support from national actors on SGBV<br />
to support victims of violence is also needed. In the short term, the scaled-up presence of police patrols and additional<br />
security measures, such as emergency lighting in order to safeguard affected communities and mitigate the risks of SGBV,<br />
are needed. In the medium to long term, review and reform of the legal process for reporting and responding to rape<br />
and gender-based violence in order to make it more accessible to women and girls may be required. Training of law<br />
enforcement on SGBV prevention and response and how to treat SGBV cases seriously and sensitively is essential.<br />
122<br />
Based on the same 51 percent increase change between 2002 (15 percent) and 2008 (31 percent), we can assume that washing machine<br />
prevalence at the household level in now 70 percent..<br />
123<br />
<strong>Fiji</strong> Gender Based Violence Sub-Cluster Key Advocacy Note: April 9, 2016.<br />
124<br />
No information was available on issues related to sexual orientation and ethnicity. Issues faced by the elderly population are covered in<br />
the ELSP Chapter.<br />
125<br />
<strong>Fiji</strong> Women Crisis Centre 2013: Women’s Health and Domestic Violence Against Women Study.<br />
126<br />
“Someone’s Life, Everybody’s Business.” National Research on Women’s Health and Life Experiences in <strong>Fiji</strong> (2010/2011): A survey<br />
exploring the prevalence, incidence and attitudes to intimate partner violence in <strong>Fiji</strong>. <strong>Fiji</strong> Women’s Crisis Centre.<br />
127<br />
<strong>Fiji</strong> Gender Based Violence Sub-Cluster Key Advocacy Note: April 9, 2016.<br />
Tropical Cyclone Winston, February 20, 2016<br />
103
FIJI Post-Disaster Needs Assessment<br />
Child Protection: An estimated 120,000 children have been moderately to severely affected (40 percent of the child<br />
population). Approximately 55 percent of schools and early childhood care and education centres were damaged or<br />
destroyed, disrupting schooling for almost 86,000 students. Use of violence against children is high with a baseline study<br />
on child protection in <strong>Fiji</strong> highlighting the acceptance of physical punishment as a means of disciplining children. Sexual<br />
violence against children is also high with almost one in five women sexually abused before the age of 15. Furthermore,<br />
Save the Children and the ILO highlight a significant market for child sex in <strong>Fiji</strong>. 128 In 2015, 115 cases of child sexual abuse<br />
were reported to the Department of Social Welfare and 612 child welfare cases were reported, including neglect, physical<br />
and emotional abuse, and severe malnutrition. As a result of the cyclone, increased stress on and vulnerability of families<br />
and caregivers, and abuse rates are expected to increase, with anecdotal reports from police and welfare officers already<br />
indicating the need for interventions. Continued support to the Ministry of Education’s programme in tracking children<br />
who may have moved schools or dropped out is required. Programmes to provide psychosocial support to children and<br />
caregivers are also needed to reduce the long-term impact of psychological distress.<br />
Disability Issues: The <strong>Fiji</strong> National Council for Disabled Persons estimated that 1 percent (11,402 people) of the <strong>Fiji</strong>an<br />
population is living with some form of disability. The Pacific Disability Forum further estimates that about 4,534 PLWD have<br />
been affected by the disaster; however, this figure could be higher as a result of injuries sustained during the cyclone.<br />
Disasters make the situation worse for PLWD, with regard to access to essential services, such as the challenges created<br />
by debris caused from the cyclone. Physiotherapy services for those recovering from injuries will also be needed. Efforts<br />
should be made to reach women with injuries who may not seek services or who may have family members that do not see<br />
the need to support them in seeking medical help. Disasters can lead to loss of or additional burdens on caretakers, who<br />
are often women. Efforts to identify, document and support people who have become disabled as a consequence of the<br />
disaster through social benefit schemes are essential. This support should include linking people with debilitating injuries<br />
to the disability community for social support. Close linkages between the MoHMS and the Department of Social Welfare<br />
and NGOs providing psychosocial support is needed.<br />
Gender and Social Inclusion Recommendations<br />
While women and different social groups have been disproportionally affected by TC Winston, simply viewing them as<br />
victims of the disaster only serves to exacerbate their vulnerability. As women’s contribution to the household economy is<br />
substantial, they will be a critical partner in the rapid recovery of <strong>Fiji</strong>an households and wellbeing and the entire affected<br />
population. Post-disaster recovery resources must strive to safeguard, restore and promote the economic engagement<br />
and participation of disadvantaged groups. Recovery efforts must redress gender inequalities or, at the very least, not<br />
perpetuate unequal access to power and resources. Such recovery strategies are outlined below.<br />
<br />
<br />
<br />
<br />
<br />
<br />
<br />
<br />
<br />
Targeted investment through extension, soft loans and skills development must be made in areas with a high<br />
representation of women, particularly in the informal sector in agriculture, markets and SMEs.<br />
<br />
especially in food crops controlled by women. Investment in subsistence agriculture must be done in tandem with<br />
non-farm skills and market development.<br />
<br />
inequality faced by women and vulnerable groups.<br />
<br />
jobs, such as community infrastructure rehabilitation and public works.<br />
<br />
families will be critical for ensuring that assistance reaches the most vulnerable groups, including pregnant women,<br />
the elderly and PLWDs.<br />
<br />
an integral part of recovery strategies for all sectors.<br />
<br />
toilets and wash facilities that allow privacy and protection.<br />
<br />
affected communities. Psychosocial support should be made available to men, women and children in the affected<br />
areas.<br />
128<br />
ADB 2015: <strong>Fiji</strong> Country Gender Assessment<br />
104 Tropical Cyclone Winston, February 20, 2016
FIJI Post-Disaster Needs Assessment<br />
Recovery and Reconstruction Needs for Gender (F$2 million)<br />
Table 70 provides a summary of the gender recovery needs of approximately F$2 million. Gender sector recovery needs<br />
are discussed in detail within the respective sector chapters.<br />
Table 70: Total Recovery and Reconstruction Needs for Gender Considerations (F$ million) 129<br />
Recovery Reconstruction Resilience Total<br />
Skills development, training and market development 0.4 0.4<br />
Consultations documentation and registration of vulnerable groups 0.1 0.1<br />
Strengthening services and referral systems for prevention of SGBV 0.7 0.7<br />
Psychosocial support to children and community members 0.1 0.1<br />
Support for the elderly, PLWD and child protection 0.1 0.1<br />
Reconstruction and rehabilitation of nine women resource centres 0.2 0.2<br />
Gender recovery monitoring and evaluation 0.2 0.2 0.4<br />
Total 1.6 0.4 2.0<br />
Source: Estimations by Assessment Team.<br />
Note: A detailed breakdown of recovery needs by sector is included in Annex 2.<br />
3.4.3 Culture and Heritage<br />
Summary<br />
TC Winston caused significant damage and losses to <strong>Fiji</strong>’s cultural assets located within the severely affected areas. The<br />
Eastern Division (Lomaiviti and Lau Provinces) constituted the most significant impacts, accounting for 74 percent of the<br />
damage and losses suffered. In total, cultural (including built heritage) and natural sites endured almost F$5 million worth<br />
of damage, impacting on the livelihood, social and cultural sustainability of <strong>Fiji</strong>an communities. Use of both traditional and<br />
modern materials during bure building endangers the continuity of such building, which reinforces the need to develop<br />
management plans that safeguard the country’s cultural assets against disaster events.<br />
Culture and Heritage Sector Background<br />
<strong>Fiji</strong> acknowledges and celebrates the rich, varied and diversified cultural repertoire of its people, and these aspirations are<br />
embedded in the 2013 <strong>Fiji</strong>an Constitution. Culture has also emerged as an integral element in the promotion of sustainable<br />
development and wellbeing. The Green Growth Framework articulates the contribution of the culture sector to economic<br />
livelihoods (local cultural producers and entrepreneurs), informed decision making (cultural statistics and data collection),<br />
knowledge sustainability (mainstreaming culture in the formal education curriculum) and resource conservation (intangible,<br />
documentary and built heritage mapping, and management). <strong>Fiji</strong>’s culture sector safeguarding activities are linked to the<br />
United Nations Educational, Scientific and Cultural Organization’s (UNESCO) mandate and activities globally and much is<br />
owed to <strong>Fiji</strong>’s ratification of the 1972 World Heritage Convention in 1990 and the 2003 Convention for the Safeguarding<br />
of Intangible Cultural Heritage in 2010. The National Cultural Policy for <strong>Fiji</strong> will facilitate a coordinated approach by cultural<br />
institutions to leverage the culture sector and its contribution to national development. The <strong>Fiji</strong> Museum Act (Cap 263),<br />
National Trust Act (Cap 265), Public Records Act (Cap 108), Libraries (Deposit of Books) Act (Cap 109) and the Preservation<br />
of Objects of Archaeological and Paleontological Interest Act (Cap 264) provide the legal underpinning for managing and<br />
protecting <strong>Fiji</strong>’s cultural heritage.<br />
<strong>Fiji</strong>’s myriad cultural resources and assets are continuously being managed and updated in registers available with the<br />
National Archives of <strong>Fiji</strong>, Ministry of iTaukei Affairs, National Trust of <strong>Fiji</strong>, <strong>Fiji</strong> Museum and <strong>Fiji</strong> Arts Council. In 2013, <strong>Fiji</strong><br />
successfully inscribed the Historical Port Town of Levuka as a UNESCO World Heritage site. Previously, the ‘Documentary<br />
Heritage of the Indian Indentured Labourers to <strong>Fiji</strong>’ was successfully listed in the International Register of the Memory of<br />
the World in 2011.<br />
The <strong>Fiji</strong> Arts Council, with six multicultural centres located around the country, promotes artistic expressions and spearheads<br />
cultural industries in <strong>Fiji</strong>, thereby enhancing local resource use for cultural product development and marketing.<br />
Levuka Historical Port Town (Levuka, Ovalau Island, Lomaiviti Province, Eastern Division), inscribed on the UNESCO<br />
World Heritage List (2013), is an outstanding example of the late 19th century Pacific port settlements and reflects the<br />
integration of local building traditions by a supreme naval power, leading to the emergence of a unique landscape. The<br />
site is currently managed by the Department of Heritage and Arts in collaboration with the Levuka Town Council and the<br />
129<br />
Gender sector recovery needs are discussed within the respective sector chapters.<br />
Tropical Cyclone Winston, February 20, 2016<br />
105
FIJI Post-Disaster Needs Assessment<br />
Damage to Navala Village cultural site, Ba<br />
Source: Institute of I Taukei Lanuguage & Culture/Ministry of I Taukei Affairs Board<br />
National Trust of <strong>Fiji</strong>. The site is an amalgamation of historical buildings, and associated infrastructure, such as bridges,<br />
seawall and landscape. Similarly, other built heritage in the greater Ovalau Island, including St. John’s Cawaci Church and<br />
Presbytery, Bishop’s Tomb and Nasuku Church (Cawaci), form an integrated whole in the protection and preservation<br />
of the Historical Port Town of Levuka as a World Heritage Site. The Levuka Management Plan defines the conservation<br />
approaches necessary to ensure that the authenticity and integrity of the site is maintained, while the Levuka Heritage<br />
Register maintains a listing of all buildings in the nominated property.<br />
Navala Cultural Space (Navala Village, Ba Province, Western Division) is an important cultural space and the only surviving<br />
village in <strong>Fiji</strong> whereby bures are still used and maintained using natural raw materials. The genesis of the village traced back<br />
to ancestors of current keepers in the 19th century. The village now hosts about 700 residents who live in the thatched<br />
structures. Situated in a valley surrounded by scenic forest cover, Navala Village is a unique cultural space that has the<br />
potential to be listed under the 2003 UNESCO Convention for the Safeguarding of the Intangible Cultural Heritage.<br />
Cultural and Natural Heritage Sites: The <strong>Fiji</strong> Museum and the National Trust of <strong>Fiji</strong> manage various cultural and natural<br />
heritage sites. Twenty featured sites, which have archaeological, historical and aesthetic values, were surveyed, and three<br />
sustained damage from the cyclone. The first site, Makogai Research Station, was sanctioned in 1908 as a leprosarium<br />
for people infected with Hansen’s disease (leprosy). Now a Marine Protected Reserve, it has numerous built and natural<br />
heritage and archaeological features. The second, Tavuni Hill Fort (c. 1800 AD) in Sigatoka, is an archaeological site with<br />
distinctive stone aligned house mounds, burials, historic stones and other cultural deposits. The site has been a tourist<br />
attraction for 27 years and is managed by the local community. The third site, the Bouma National Heritage Park in Taveuni,<br />
was established in 1991 as a natural heritage site.<br />
10%<br />
Damages<br />
3%<br />
Losses<br />
5%<br />
9%<br />
5%<br />
Western<br />
Northern<br />
9%<br />
Eastern<br />
Central<br />
Western<br />
Northern<br />
Figure 35: Summary of Damage and Losses Incurred at the Divisional Level<br />
Source: Estimations by Assessment Team.<br />
82%<br />
77%<br />
Eastern<br />
Central<br />
106 Tropical Cyclone Winston, February 20, 2016
FIJI Post-Disaster Needs Assessment<br />
Intangible Cultural Heritage: The sustainability of traditional knowledge and intangible heritage of local cultures rests on<br />
the transmission of the latter from the bearer or keeper to the younger generation. Intangible Cultural Heritage defines the<br />
culture of the <strong>Fiji</strong>an people, and research and documentation in <strong>Fiji</strong>’s 14 provinces helps in the continuity of age old cultures<br />
and traditions. The data is stored in the Ministry of iTaukei Affairs’ National iTaukei Database for Traditional Knowledge and<br />
Expressions (NTDTKE).<br />
Repositories of Heritage: <strong>Fiji</strong> has a collection of built repositories housing numerous collections of art, artefacts and<br />
documentary heritage, among others, 12 of which were identified for assessment, including the <strong>Fiji</strong> Museum, Ba Museum,<br />
National Archives of <strong>Fiji</strong> and various art galleries.<br />
Cultural Industries: Cultural industries are important for wealth creation, growth, sustainable development and social<br />
security. <strong>Fiji</strong>an cultural industries feature local musicians, traditional handcraft, <strong>Fiji</strong> Fashion Week, <strong>Fiji</strong> visual arts, local media<br />
and advertising. The production and promotion of cultural goods and services significantly improves the quality of life of<br />
people.<br />
Assessment of Disaster Effects on the Culture and Heritage Sector (F$6 million)<br />
Culture and heritage have high symbolic value and mirror a nation incorporating elements ranging from built and intangible<br />
heritage to documentary heritage, repositories of heritage and cultural producers and products (which encompasses the<br />
cultural industries). TC Winston caused damage in provinces that feature a significant proportion of <strong>Fiji</strong>’s cultural heritage<br />
assets and associated activities.<br />
With the limited baseline information available, the cyclone damage assessment for the sector aimed to be a strategic<br />
rather than an exhaustive evaluation of the destruction. The assessment was province-based and later aggregated to<br />
divisional levels. The main provinces that were adversely affected included: Ba, Ra and Nadroga in the Western Division;<br />
Bua, Cakaudrove and Macuata in the Northern Division; Lau and Lomaiviti in the Eastern Division; and Rewa in the Central<br />
Division.<br />
Levuka Historical Port Town (Levuka, Ovalau Island, Lomaiviti Province, Eastern Division): The cyclone has left <strong>Fiji</strong>’s built<br />
heritage at a crossroads in the damage-affected regions and there is the risk of loss of original structures and materials at<br />
the Levuka World Heritage Site. While 70 percent of the heritage buildings in Levuka experienced minor damage, some<br />
did sustain major damage: 20 percent are uninhabitable or unusable without repair; 7 percent require major repairs; and 3<br />
percent are damaged, beyond repair. These buildings, such as the Pacific American Fish Company Copra Sheds and Ports<br />
Building, still hold heritage values, yet must be reconstructed to ensure their integrity is protected. Little damage occurred<br />
to channels and bridges, but the seawall along Beach Street and the main wharf in Levuka suffered significant damage.<br />
Major damage was also sustained by the Catholic Churches at St. Johns College, and Nasuku at Cawaci. While there was<br />
less financial loss than expected, few businesses had to close while awaiting repairs to buildings. Despite this, the Levuka<br />
Wharf is closed for use, and the restoration budget set by the Department of Heritage and Arts for Levuka was diverted<br />
towards salvaging operations to recover materials onsite and ‘first-aid’ assistance for building owners. There is also the<br />
potential of loss in the movement of significant heritage collections/items stored within damaged buildings.<br />
Navala Cultural Space (Navala Village, Ba Province, Western Division): Strong winds severely affected most of the bures.<br />
Twenty-five bures suffered minor damage but are still habitable; 39 bures are currently uninhabitable and require minor<br />
repairs to be habitable; 30 bures sustained major damage and will require extensive repairs before they become habitable;<br />
and 32 bures are permanently damaged and require reconstruction. Navala Village also pursues a small-scale cultural<br />
tourism venture, which is a major source of developmental income for the site.<br />
Cultural and Natural Heritage Sites: Many of the built and natural heritage, including archaeological features of Makogai<br />
Research Station, were damaged by the cyclone including the old cleansing facility for leprosy patients. Associate<br />
accommodation structures owned by the Department of Fisheries were also severely damaged resulting in reduced visitors<br />
to the site. In Western <strong>Fiji</strong>, the Tavuni Hill Fort Archaeological Site was severely affected during the cyclone, including<br />
the uprooting of trees, village railing posts and a bure shelter. The site was closed for clearing of debris and there were<br />
restrictions on visitor access. Similarly, the Bouma National Heritage Park in Taveuni suffered damage to visitor facilities,<br />
tracks and other infrastructure, which hindered visitor arrivals.<br />
Intangible Cultural Heritage and Repositories of Heritage: The PDNA assessment drew from the Ministry of iTaukei<br />
Affairs’s NTDTKE data in the cyclone-affected provinces (the district of Vanua Balavu in Lau, the district of Koro in Lomaiviti<br />
and the entire province of Ra) in order to assess the effects on intangible cultural heritage. Damage concentrated on: raw<br />
materials necessary to fuel the production of costumes for rituals, prepare herbal medicine, etc.; totemic plants/trees; and<br />
crops and animals important for rituals and ceremonies. The loss of these important cultural agents has the potential to:<br />
contribute to the deterioration of cultural values of people; diminish sanctification of taboo areas; impact on social and<br />
cultural rituals, ceremonies and rites; and, in the worst cases, lead to a relocation of village sites and inhabitants.<br />
Tropical Cyclone Winston, February 20, 2016<br />
107
FIJI Post-Disaster Needs Assessment<br />
In the cyclone-affected provinces, three out of the 12 repositories of heritage assessed experienced medium to extensive<br />
damage. While the National Archives of <strong>Fiji</strong> reported no damage to documentary heritage repositories, the Ba Museum<br />
suffered structural damage and was closed at the time of this PDNA assessment. The <strong>Fiji</strong> Museum suffered major roof<br />
leakage, causing flooding in most of its exhibition gallery areas and was also temporarily closed. The Waisiliva Art Gallery<br />
at Leleuvia Island suffered extensive damage, with the collapse of the gallery roof. The art collection, however, was not<br />
destroyed or affected. The cyclone hit the Tutu Training Centre in Taveuni and damaged 22 of its buildings. The Tutu<br />
Training centre provides vocational training to adult learners in the areas of craft development, and displays and markets<br />
its students’ art.<br />
Cultural Industries: Cultural producers (crafters and artisans) impacted by TC Winston have suffered significant losses to<br />
their raw material supply, including kuta from Vanua Levu, voivoi from Koro, Lau, Ra and Ba, and masi bark from Vatulele.<br />
The producers’ livelihoods are strained, causing stress in trying to meet their families’ needs.<br />
Table 71: Damage and Losses in the Culture and Heritage Sector by Division (F$ million)<br />
108 Tropical Cyclone Winston, February 20, 2016<br />
Damage Losses Total Effects Public (%) Private (%)<br />
Central 0.02 0.04 0.06 0 100<br />
Eastern 4.30 0.08 4.38 32 68<br />
Northern 0.25 0.08 0.33 0 101<br />
Western 0.53 0.65 1.18 0 102<br />
Total 5.10 0.845 5.95 24 77<br />
Source: Estimations by Assessment Team.<br />
Recovery and Reconstruction Needs for Culture and Heritage (F$9 million)<br />
The estimated recovery needs for culture and heritage totals F$9.1 million (Table 72) and incorporates the principle of BBB.<br />
The core of the short-term (2016-2017) strategy for recovery focuses on the rehabilitation and restoration works in the<br />
Historical Port Town of Levuka in the Eastern Division. Maintaining the outstanding universal value of the site is critical to<br />
ensuring that it retains its iconic status. The rehabilitation of Navala Village is also pivotal, as its tangible and intangible<br />
characteristics require urgent safeguarding. However, a thorough technical assessment will first be required. In the medium<br />
to long term, continued rehabilitation of the Levuka World Heritage Site will be ongoing, along with targeting enhanced<br />
opportunities for cultural producers through the regeneration of raw materials, and capacity-building initiatives to sustain<br />
and augment skills in cultural products and in traditional architectural building and conservation.<br />
Knowledge management, capacity building and advocacy for DRR of the culture sector must be strengthened through a<br />
network of cultural heritage sites and institutions facilitated by an interim Blue Shield Pasifika in order to fully integrate DRR<br />
of the culture sector into the national DRR plan.<br />
Table 72: Total Recovery and Reconstruction Needs for the Culture and Heritage Sector (F$ million)<br />
Emergency technical assessment of damage, repair requirements<br />
and status of intangible cultural heritage<br />
Repair and reconstruction of traditional houses, built heritage,<br />
repositories of heritage, etc.<br />
Immediate capacity building of traditional architectural skills, basic<br />
conservation timber and stone architectural knowledge, and skills<br />
and product development workshop<br />
Construction of Navala ethnological museum and adjoining<br />
exhibition office facilities for tourism purposes<br />
Construction and installation of basic amenities in Navala,<br />
including electricity, water supply, fire hydrant system sewerage<br />
Regeneration of essential traditional architectural raw materials<br />
(environmental)<br />
Development and implementation of DRR plan for all cultural<br />
domains and safeguarding plans for intangible cultural heritage<br />
Establishment of incubation spaces, galleries and advisory portals<br />
for cultural goods producers<br />
Recovery Reconstruction Resilience Total<br />
0.2 0.2<br />
0.1 7.4 7.5<br />
0.2 0.2<br />
0.2 0.2<br />
0.5 0.5<br />
0.1 0.1<br />
0.1 0.1 0.2<br />
0.2 0.2<br />
Total 0.6 8.5 9.1<br />
Source: Estimations by Assessment Team.<br />
Note: A detailed breakdown of recovery needs by sector is included in Annex 2.
4.<br />
Damaged Police Station on Viti Levu<br />
Source Chris Wensley/ADB<br />
DISASTER RISK MANAGEMENT<br />
Tropical Cyclone Winston, February 20, 2016 109
FIJI Post-Disaster Needs Assessment<br />
4.1 Introduction<br />
DRM in <strong>Fiji</strong> has evolved significantly over the past three decades towards a proactive, holistic and inclusive approach to<br />
DRR, preparedness, response and resilient recovery within and across all sectors. The Green Growth Framework, which<br />
underpins development planning in <strong>Fiji</strong>, calls for a more integrated and targeted approach to mitigation and prevention<br />
measures, contextualising global frameworks around DRR, climate change and sustainable development. TC Winston<br />
provided an opportunity to reflect on the performance of the DRM system, which includes the arrangements, as well as<br />
institutional and community capacities, that contribute to DRM in <strong>Fiji</strong>.<br />
4.2 DRM Sector Background<br />
CABINET<br />
National Disaster Management<br />
Council<br />
Mitigation & Prevention Committee<br />
Preparedness Committee<br />
National Disaster Controller &<br />
Emergency Committee<br />
Disaster Service<br />
Liaision Officers<br />
National Disaster Management<br />
Office & NEOC<br />
Divisional Commissioner<br />
Western & DivEOC<br />
Divisional Commissioner<br />
Central & DivEOC<br />
Divisional Commissioner<br />
Northern & DivEOC<br />
Divisional Commissioner<br />
Eastern & DivEOC<br />
District DISMAC<br />
(6)<br />
District DISMAC<br />
(5)<br />
District DISMAC<br />
(4)<br />
District DISMAC<br />
(3)<br />
Figure 36: National Disaster Management Structure<br />
Source: NDMO.<br />
110 Tropical Cyclone Winston, February 20, 2016
FIJI Post-Disaster Needs Assessment<br />
New Zealand Defense Force base of operations within the Adi Maopa Secondary School grounds on Vanuabalavu<br />
Source: Litea Biukoto/SPC<br />
Figure 36 illustrates the National Disaster Management structure, defined by the Natural Disaster Management Act 1998<br />
and the National Disaster Management Plan 1995, which describes the governance and institutional arrangements for DRM<br />
in <strong>Fiji</strong> and the attendant operational systems and processes. 130 <strong>Fiji</strong> has had a “Cyclone Support Plan” in effect since 1997,<br />
which details procedures for preparedness, warnings, response and other practical aspects of cyclone management, as<br />
well as clear roles and lines of responsibility. A more detailed description of the responsibilities can be found in the <strong>Fiji</strong> PDNA<br />
(2013) 131 and in Annex 6: Disaster Risk Management of this PDNA.<br />
4.3 Damage and Losses in the DRM Sector<br />
Damage to the DRM sector totals F$2 million, while losses equal F$30 million. Damage within the DRM sector relates<br />
primarily to buildings and equipment within the <strong>Fiji</strong> Police Force and the <strong>Fiji</strong> Meteorological Services (FMS). The Ministry of<br />
Rural and Maritime Development and National Disaster Management incurred the majority of losses, which relate to the<br />
cost of purchasing and distributing emergency food rations. Losses in the private sector were limited and relate to rented<br />
buildings and vehicles.<br />
Table 73: Damage and Losses in the DRM Sector by Agency (F$ million)<br />
Agency Damage Losses Total Effects Private (%) Public (%)<br />
Ministry of Rural and Maritime Development<br />
and National Disaster Management<br />
0.2 27.5 27.7 0.01 99.99<br />
<strong>Fiji</strong> Police Force 1.2 0.0 1.2 0 100<br />
<strong>Fiji</strong> Meteorological Service 0.6 0.0 0.6 0 100<br />
Mineral Resources Department 0.1 0.0 0.1 0 100<br />
Other DRM Actors 0.0 0.0 0.0 50 50<br />
Total 2.1 27.5 29.6 0.02 99.98<br />
Source: Estimations by Assessment Team.<br />
130<br />
A description of the role of key government stakeholders in DRM in <strong>Fiji</strong>, as stipulated in the National Disaster Management Act and Plan<br />
is provided in Annex 6.<br />
131<br />
Government of <strong>Fiji</strong>, 2013, PDNA Tropical Cyclone Evan December 17, 2012.<br />
Tropical Cyclone Winston, February 20, 2016<br />
111
FIJI Post-Disaster Needs Assessment<br />
Table 74: Damage and Losses in the DRM Sector by Division (F$ million)<br />
Division Damage Losses Total Effects Private (%) Public (%)<br />
Central 0.2 2.8 3.0 0.03 99.97<br />
Eastern 0.6 3.5 4.1 0.07 99.93<br />
Northern 0.3 8.7 9.0 0.00 100.00<br />
Western 0.9 12.4 13.3 0.01 99.99<br />
Total 2.0 27.4 29.4 0.02 99.98<br />
Source: Estimations by Assessment Team.<br />
4.4 Performance of the <strong>Fiji</strong> DRM System<br />
Interviews, focus groups and questionnaires with key informants were used to examine the performance of <strong>Fiji</strong>’s overall<br />
DRM system in relation to TC Winston. This section provides insights gleaned from these questionnaires in terms of what<br />
worked well and what areas need strengthening, as well as analysis on the performance of the DRM system undertaken<br />
as part of this PDNA.<br />
4.4.1 Tropical Cyclone Forecasting<br />
Although TC Winston was a challenging system to forecast with frequent and dramatic changes in its path, both the<br />
manned and automatic monitoring stations of the FMS were effectively transmitting data to the forecasting centre in Nadi<br />
allowing forecasters to track and predict TC Winston and prepare warning messages for the public. While a number of<br />
FMS weather stations sustained damage, their ability to forecast TC Winston’s track was not affected. Ways to further<br />
increase resilience of the monitoring and early warning systems should be considered during the reconstruction and repairs<br />
of damaged equipment.<br />
4.4.2 Early Warning<br />
Early warning messages were issued by the FMS and the private sector weather forecaster, NaDraki, and distributed using<br />
print and social media, radio and websites. Pre-existing campaigns, such as Get Ready. Disasters Happen. (getready.<br />
gov.fj), were rolled out in preparation for TC Winston, which provided the public with regular messaging on what to do to<br />
prepare for and what to do following TC Winston. However, complementary resources to support the development and<br />
regular dissemination of risk reduction messages are lacking.<br />
Social media campaigns, such as #<strong>Fiji</strong>WillRise and #StrongerThanWinston, were quickly established and rapidly gained<br />
momentum, creating a sense of hope and resilience within the community, which is essential for both material and<br />
psychosocial recovery.<br />
<strong>Fiji</strong>’s limited experience with such intense tropical cyclones as TC Winston meant that public understanding of the<br />
characteristics of a Category 5 system and its associated risks was inadequate. A number of coastal communities expected<br />
strong winds, but were unprepared for the intensity of the storm surge, which contributed to poor decision making in<br />
relation to the location of evacuation centres and housing in coastal areas.<br />
Regular DRM training for journalists should be encouraged to maximise the impact of public information campaigns and<br />
to ensure that journalists and broadcasters are clear and confident when they relay early warning messages to the public<br />
in English, iTaukei and Hindi. Training should also be provided on ethical reporting during disasters to avoid insensitive or<br />
sensationalist reporting.<br />
4.4.3 Addressing the Needs of Vulnerable Groups<br />
More can be done to further disseminate early warnings to a wider audience, especially the vulnerable population. Television<br />
broadcasts could add sign language to the warnings, and text messages could be sent targeting the hearing impaired.<br />
Disability inclusive DRR in <strong>Fiji</strong> was initially accepted and supported by NDMO through its implementing partner Act for<br />
Peace and a toolkit adopted in 2013. Further work remains to ensure that evacuation centres are accessible and safe<br />
for people with disabilities and that an information management system is available so that necessary data is collected to<br />
ensure appropriate support can be provided to people with disabilities.<br />
112 Tropical Cyclone Winston, February 20, 2016
FIJI Post-Disaster Needs Assessment<br />
4.4.4 Key Highlights<br />
The ‘Build Back Better’ Strategy<br />
The BBB Strategy applied by the Ministry of Rural and Maritime Development and National Disaster Management to the<br />
reconstruction of homes destroyed by TC Evan in 2012 paid clear dividends as these homes, despite being in its path,<br />
withstood TC Winston’s impact. BBB messaging has been strong after TC Winston. For example, the Shelter Cluster<br />
had released a graphical poster in English, iTaukei and Hindi to promote simple BBB construction techniques. Similar<br />
campaigns should be used for non-structural recovery measures.<br />
National Cluster System<br />
The national cluster system was introduced for TC Evan and tested for the second time during TC Winston. The cluster<br />
system is designed to supplement existing DRM institutional structures, as well as improve coordination with national and<br />
international partners. The Food Security and Livelihoods Cluster, for example, is a model of good practice with work<br />
plans, monthly meetings and a dedicated Disaster Liaison Officer, who is also active in risk reduction activities outside of a<br />
disaster. The nine national clusters are: Communications; Education; Food Security and Livelihoods; Health and Nutrition;<br />
Logistics; Public Works and Utilities; Shelter; Safety and Protection; and WASH.<br />
Civil-Military Coordination<br />
Civil-military coordination was also strengthened. NEOC set up dedicated liaison capacity during TC Winston to assist in<br />
deploying military assets from Australia, New Zealand, France and <strong>Fiji</strong>. Liaison and coordination improvements enabled the<br />
rapid deployment of equipment, personnel and supplies to affected areas.<br />
Emergency Response Operations<br />
The disaster response operations clearly demonstrated the high level of leadership and commitment by the government<br />
to respond effectively to the various humanitarian requirements in the immediate post-event period. The NEOC was fully<br />
activated well in advance of the cyclone making landfall and coordination worked well between the NEOC and various<br />
agencies, such as the FMS, which issued regular advisories on the cyclone track, enabling a good understanding of areas<br />
of potential impact that allowed for adequate preparations.<br />
4.4.5 Areas for Improvement<br />
National Disaster Management Plan and Legislation<br />
Reviewing and revising the National Disaster Management Plan 1995 and the Natural Disaster Management Act 1998 is<br />
timely, as their respective promulgation instruments have undergone reviews on several occasions, particularly following<br />
major disasters. Despite this, no significant adjustments have been made to the arrangements. Such a revision would, for<br />
example, better contextualize the PDNA, recovery process, national cluster system and other systemic changes introduced<br />
over time.<br />
The current NDMO governance arrangements could benefit from updating given the increasingly complex interrelations<br />
between and among agencies, nationally, regionally and globally. The more active roles of NGOs and the complex intertwining<br />
of issues between disaster and climate change and the environment require a range of engagement and diplomacy beyond<br />
the conventional scope of disaster preparedness and response. In addition, expectations have increased over time such as<br />
the need to recruit and retain specialist skills in, for example, planning, operations management, information management<br />
and risk management.<br />
Information and Communications Platform<br />
An upgraded information and communications platform is needed to better facilitate information flows prior to and after<br />
events. This will help to expedite damage reporting particularly from rural areas and formally incorporate the use of social<br />
media as an additional tool to enhance the understanding of disaster impacts.<br />
Common Incident Management System<br />
Establishing a common incident management system will complement the overarching governance arrangements as<br />
captured in the National Disaster Management Plan 1995 and Natural Disaster Management Act 1998. The incident<br />
management system will facilitate more coordinated preparedness and response operations at the national and subnational<br />
levels, and, thus, more effectively unite all stakeholders under a single operating system.<br />
Tropical Cyclone Winston, February 20, 2016<br />
113
FIJI Post-Disaster Needs Assessment<br />
Relief Tracking System<br />
The current system of tracking the distribution of relief supplies requires strengthening, as supplies are only able to be<br />
tracked as far as the <strong>Fiji</strong> Procurement Office warehouses. However, once supplies are distributed to the divisions, no<br />
real-time system exists to record the subsequent movement of supplies. As a result, the NEOC and the National Disaster<br />
Management Council (NDMC) have no evidence that relief items centrally provided through the government system<br />
are reaching the targeted communities. The inability of the government to track relief supplies means that other nongovernmental<br />
entities are unable to coordinate their efforts effectively with the national system.<br />
Adapting the Cluster System at Sub-National Levels<br />
The decentralisation of the national response system to the division and district level, while a sound concept in principle,<br />
has not included the requisite budget, planning, information management and logistical capabilities to enable more<br />
effective coordination. The cluster system is properly functional at the national level but not at the sub-national level, where<br />
having stakeholders coalesce for preparedness and response is imperative. However, the majority of venues where cluster<br />
meetings were held, including the NEOC, are inaccessible to people with disabilities, which compromises their ability to<br />
contribute to the clusters.<br />
Recovery Coordination<br />
In terms of recovery, overall responsibility currently rests with the Ministry of Rural and Maritime Development and National<br />
Disaster Management, based on the National Disaster Management Plan 1995 and the National Disaster Management Act<br />
1998. However, for TC Winston, the government has designated the SPO within the Ministry of Finance, National Planning<br />
and Statistics to provide leadership and coordination for recovery implementation. Thus, revisions to the disaster legislation<br />
should refer to the new role and responsibilities of the SPO accordingly.<br />
Damage Assessment Forms<br />
The design of the damage assessment field survey forms used post-event in the field should be revisited as opportunities<br />
were missed for some PDNA sectors in collecting baseline/damage data. When the necessary data is captured during<br />
initial field surveys, the subsequent PDNA processes can be efficient.<br />
Information collected during this rapid stage, when done well, could be very useful for subsequent recovery planning.<br />
Considerations on using standardized software, for example, the free, open source software KoBo Toolbox, and electric<br />
handheld data collection systems for damage assessments, could be made to speed up data collection, collation and<br />
analysis and address consistency issues of the data recorded.<br />
4.4.6 Partnerships<br />
The need for improved networking and coordination among stakeholders involved in DRM in <strong>Fiji</strong> was again highlighted by TC<br />
Winston. Current governance arrangements, while providing the opportunity for improved partnerships, still have a strong<br />
government-centric disposition. The national cluster system provides for networking and coordination with international<br />
partners, but local NGOs and the private sector are not privy to regular consultations on matters pertaining to DRM.<br />
Consultations revealed that the private sector met challenges in obtaining information from the NEOC to inform the<br />
community support initiatives that various businesses were involved with, necessitating separate assessments and decision<br />
making that may have duplicated the government’s own initiatives. A stronger relationship with the private sector through<br />
mechanisms, such as the <strong>Fiji</strong> Commerce and Employers Federation, hotels association and others would enhance efforts<br />
being undertaken to improve preparedness and response to disasters, as well as DRR.<br />
Civil society and NGOs are also a significant group through which the government can ensure widespread DRM efforts.<br />
Local NGOs, in particular, must have stronger linkages with the government, and its umbrella coordination body, the <strong>Fiji</strong><br />
Council of Social Services, must be strengthened so that it can more effectively act as the conduit through which local level<br />
actors interface with the government.<br />
In relation to the international community and, in particular, those that supported the cluster system, the relationship with<br />
the government system appeared to function well. International partners were active in providing advice and technical<br />
support to enable decision making on relief and early recovery by the various clusters. National communications cluster<br />
members were highly effective and a successful example of good practice in public-private sector engagement. In the early<br />
stages of the response, the Pacific Humanitarian Team was also active.<br />
114 Tropical Cyclone Winston, February 20, 2016
FIJI Post-Disaster Needs Assessment<br />
The national cluster system is maturing well and the reliance on external partner support may not be as critical in the future.<br />
For example, in terms of logistics, this role was largely fulfilled by the <strong>Fiji</strong> Procurement Office and NDMO with the support of<br />
military assets from <strong>Fiji</strong>, Australia, New Zealand and France. The role, therefore, of international partners, in particular, must<br />
be redefined in the context of ensuring the strengthening and sustainability of <strong>Fiji</strong>’s own future capacities.<br />
4.4.7 Monitoring and Evaluation<br />
TC Winston led to the deaths of 44 people and a significant number of serious injuries. Further investigation should be<br />
undertaken to derive lessons learned from the factors that caused these deaths and injuries to prevent deaths from<br />
occurring during the next event.<br />
The future performance of the DRM system in <strong>Fiji</strong> will improve significantly if a focused and well-structured monitoring and<br />
evaluation system is in place. In recent years, <strong>Fiji</strong> has benefitted from global initiatives, such as the periodic national review<br />
of the Hyogo Framework for Action, which was superseded by the Sendai Framework for DRR. Such reviews allow <strong>Fiji</strong><br />
the opportunity to self-evaluate its performance against a series of DRR and DRM indicators. In this connection, a biennial<br />
report on the state of DRM could be produced. Such a report would provide an overview of progress of DRM initiatives<br />
established in policies and plans and help determine the nature and extent of further investments in DRM that may be<br />
required across the economy.<br />
For the recovery programme, strong and effective monitoring and evaluation capacity is required to determine the extent of<br />
the application of BBB principles, including, for example, the use of hazard risk information to inform building reconstruction<br />
and policy development. Priority 4 of the Sendai Framework for DRR, ‘Enhancing disaster preparedness for effective<br />
response and BBB in recovery, rehabilitation and reconstruction’ will provide useful guidance.<br />
4.5 Understanding Risk<br />
In disaster-prone areas, the availability of reliable and relevant risk information is critical in making decisions for reducing the<br />
negative effects from natural hazards, such as droughts, floods, tropical storms and cyclones. While risk assessment tools<br />
are available in <strong>Fiji</strong>, their application is not a requirement for development planning and implementation. Thus, such tools are<br />
often overlooked, resulting in development activities that do not address hazard-related risks and associated vulnerabilities.<br />
Stronger efforts should be made to embed the use of hazard and risk information in development planning and decision<br />
making. Demonstration projects, such as Strengthening Disaster and Climate Risk Resilience in Urban Development in the<br />
Pacific (Nadi), should be extended to other towns in <strong>Fiji</strong> to improve land-use planning and development consent processes.<br />
Homes destroyed by storm surge on Koro Island, Eastern Division<br />
Source: Ministry of Information<br />
Tropical Cyclone Winston, February 20, 2016<br />
115
FIJI Post-Disaster Needs Assessment<br />
Mainstreaming disaster and climate risk within the national (and sub-national) development planning and budgetary<br />
system varies between sectors and levels of government, and needs to be consistent and enforced to ensure sustainable<br />
development, more resilient systems and safer communities to reduce future damage and loss from disasters.<br />
4.5.1 Identifying Increased Risks as a Result of TC Winston<br />
Following TC Winston, the damage incurred on some communities may have increased future risks from hazards. For<br />
example, where coastal defences were destroyed by storm surges, the risk from future storm surges, king tides and high<br />
tides to the community will have increased. Similarly, damage to vegetation on slopes has increased the future risk from<br />
landslides. As such, detailed surveys should be conducted to identify new risks in affected communities. Identification of<br />
new risks should be prioritized in areas where schools, health centres and critical infrastructure will be reconstructed.<br />
4.5.2 Promoting Risk Awareness at the Community Level<br />
Resilience at the community level is a critical component and outcome of an effective DRM system. Investment in<br />
community-based DRM (CBDRM) and climate change adaptation (CCA) activities can enhance community understanding<br />
of the risks to which the community is exposed and support the implementation of effective prevention, mitigation and<br />
preparedness activities. CBDRM initiatives are implemented by many agencies and government departments in <strong>Fiji</strong>. For<br />
example, Nawaqarua village in Ba Province constructed a community evacuation centre and conducted evacuation drills<br />
following participation in CBDRM training, which contributed to the fact that no lives were lost during TC Winston despite<br />
Ba being one of the most affected areas.<br />
Common methodologies for CBDRM and CCA initiatives with clear links to sub-national government processes should<br />
be encouraged. For instance, in the Western Division, CBDRM and CCA activities are already being integrated into the<br />
community and divisional development process, thereby ensuring that root causes of disaster risk are being addressed.<br />
This also provides an opportunity for investment in community infrastructure to be informed by an understanding of current<br />
and future risks to ensure resilience.<br />
4.6 Funding and Finance Mechanisms<br />
4.6.1 Building Fiscal Resilience<br />
While improving the resilience of the citizens of <strong>Fiji</strong> is paramount, the Government of <strong>Fiji</strong> should also aim to improve the<br />
country’s fiscal resilience to natural and climatic disasters. The first step to building fiscal resilience is to understand the<br />
country’s disaster risk profile as mentioned above. Once the hazard exposure is understood, actuarial analysis can be<br />
undertaken to provide indicative financial losses to these disasters.<br />
This analysis was undertaken for tropical cyclones and earthquakes/tsunamis in the PCRAFI, which noted that <strong>Fiji</strong> faced<br />
average annual losses of F$158 million (US$85 million) due to earthquakes and tropical cyclones. Furthermore, in the next<br />
50 years, <strong>Fiji</strong> has a 50 percent chance of experiencing a loss exceeding F$1.5 billion (US$806 million) and a 10 percent<br />
chance of a loss exceeding F$3 billion (US$1.6 billion). 132<br />
This PDNA provides an actual calculation of damage and losses which, when combined with past expenditures from<br />
disasters, help the government to better understand the contingent liabilities placed on the national budget from disasters.<br />
This will enable the government to develop an informed disaster risk finance and insurance strategy to build fiscal resilience<br />
against disasters.<br />
4.6.2 Disaster Risk Finance Tools in <strong>Fiji</strong><br />
<strong>Fiji</strong> has approximately F$3 million (US$1.6 million) available in contingent disaster risk finance and insurance (DRFI)<br />
instruments to facilitate disaster response. The National Disaster Relief and Rehabilitation Fund, also known as the Prime<br />
Minister’s Fund, can release up to F$1 million (US$0.5 million), and the recently established Rehabilitation Fund receives<br />
an annual appropriation of F$2 million (US$1 million). That said, in any given year, there is a 57 percent chance that <strong>Fiji</strong> will<br />
experience government emergency losses that exceed the F$3 million (US$1.6 million) contingency provision. 133<br />
132<br />
PCRAFI (Pacific Catastrophe Risk Assessment and Financing Initiative) (2011) Country Risk Profile: <strong>Fiji</strong>, September 2011.<br />
133<br />
PCRAFI (2014) Disaster Risk Finance and Insurance Note: <strong>Fiji</strong>, https://www.gfdrr.org/sites/gfdrr/files/publication/Country-Note-<strong>Fiji</strong>.pdf<br />
116 Tropical Cyclone Winston, February 20, 2016
FIJI Post-Disaster Needs Assessment<br />
4.6.3 Developing a Disaster Risk Finance and Insurance<br />
(DRFI) Strategy<br />
Options for consideration for the development of a DRFI Strategy include:<br />
<br />
<br />
<br />
<br />
Identify the level of contingent liabilities from natural disasters. This is the first step to understanding which<br />
financial tools will be most effective to reduce the burden on the fiscal purse.<br />
Develop an overarching disaster risk financing strategy aligned to existing processes. <strong>Fiji</strong> has taken a proactive<br />
ex-ante approach to DRFI by establishing dedicated domestic reserves. Available funds are limited, however, and<br />
options for risk transfer should be considered. Thus, an overarching DRFI strategy should be developed and<br />
endorsed by the cabinet, which would create a single document to articulate available financing options and the<br />
associated policies behind these tools. An action plan for implementation activities is also recommended.<br />
Consider additional financial tools beyond domestic reserves. Additional financial tools, such as contingent<br />
credit and risk transfer, will help reduce the level of contingent liabilities faced by the Government of <strong>Fiji</strong>.<br />
Build capacity within the domestic insurance industry to provide catastrophe risk insurance for buildings.<br />
This will help to reduce the rebuilding cost faced by the government and private households while providing<br />
incentives to ensure that building codes are followed and assets are maintained to an insurable quality.<br />
4.7 Recovery and Reconstruction needs<br />
for DRM<br />
In addition to the recovery and reconstruction needs identified in Table 75, there is also a need for the identification of<br />
safe relocation areas within the worst hit provinces (e.g., Lomaiviti and Ba), with existing social infrastructure. The social<br />
infrastructure and relocation costs are not adequately captured in this assessment due to unknown parameters such as<br />
scale, availability of safe relocation sites and relocation distances. These factors are not yet known and need to be further<br />
studied. A comprehensive multi-hazard risk assessment will be required to inform the resettlement planning and decision<br />
making process for both residential as well as public infrastructure, such as hospitals and schools. Priority also needs to be<br />
given to zoning of at risk areas for the various types of natural hazard risks, to enable application of appropriate engineering<br />
design solutions.<br />
Relocation of settlements must be resorted to only when no other solution is feasible. Communities requiring relocation on<br />
account of high risk areas should be consulted with a view to building a consensus on the issue, particularly with regard to<br />
livelihoods as well as socio-cultural sensitivities.<br />
Table 75: Recovery, Reconstruction and Resilience Needs in the DRM Sector (F$ million)<br />
Reconstruction, replacement and repair of priority assets and<br />
buildings<br />
Recovery Reconstruction Resilience Total<br />
2.7 2.7<br />
Strengthen governance and institutional arrangements 0.9 0.9<br />
Understand risk 2.1 2.1<br />
Strengthen community resilience 4.7 4.7<br />
Develop a comprehensive DRM communications strategy 0.2 0.2<br />
Develop a monitoring and evaluation framework and system<br />
to track the development and implementation of DRM across<br />
government agencies and publish a biennial state of DRM report<br />
0.1 0.1<br />
Invest in catastrophe risk insurance, including regional schemes 4.0 4.0<br />
Total 2.7 12.0 14.7<br />
Source: Estimations by Assessment Team.<br />
Note: A detailed breakdown of recovery needs by sector is included in Annex 2.<br />
Tropical Cyclone Winston, February 20, 2016<br />
117
5.<br />
Cleaning up at Ra High School, Ra, Viti Levu<br />
Source: Vlad Sokhin/World Bank<br />
SUMMARY OF RECOVERY,<br />
RECONSTRUCTION AND<br />
RESILIENCE NEEDS<br />
118<br />
Tropical Cyclone Winston, February 20, 2016
FIJI Post-Disaster Needs Assessment<br />
This PDNA identifies a number of key needs to support recovery and reconstruction objectives. The identification and<br />
valuation of disaster effects has been used for estimating disaster impacts at the sector, macro and micro levels, and the<br />
results of the effects and impact analyses have provided inputs for the quantification of recovery and reconstruction needs.<br />
Workshop discussions with key stakeholders, and interviews with affected people and government officials, have also<br />
supported the process.<br />
Recovery and reconstruction needs for all disaster-affected sectors of social and economic activity have been estimated<br />
within this PDNA. Recovery and reconstruction needs refer to both the private and public sectors, as both have been<br />
affected by the disaster and, thus, have also been included. This does not imply that the government should finance<br />
recovery and reconstruction for all stakeholders. Rather, it allows the government to quantify and finance those needs<br />
within its purview, and facilitate private sector recovery, for example, through interactions with the banking sector to ensure<br />
that the required credit lines are available. This approach will support the full recovery of social and economic activity by all<br />
disaster-affected sectors, people and enterprises.<br />
No one agency or group will be able to achieve recovery alone. Collaboration is essential to connect those who have a<br />
role in recovery, including those in government, business, cultural and other non-governmental sectors. By establishing<br />
and maintaining constructive relationships, agencies will be able to undertake initiatives that are coordinated, timely and<br />
enduring. Recovery activities will also need to be implemented in various ways. For example, some agencies will coordinate<br />
with each other on new initiatives and others will reorient or adapt business as usual.<br />
5.1 Modalities for Recovery and<br />
Reconstruction<br />
A range of modalities for recovery and reconstruction exist, a combination of which may be comprised of:<br />
<br />
<br />
<br />
<br />
donations for recapitalization and reconstruction purposes;<br />
<br />
to credit-worthy private individuals and businesses for both working capital replenishment and reconstruction<br />
purposes; and<br />
<br />
until universal participation is eventually reached.<br />
The government will seek to facilitate private sector participation in recovery, given that damage and losses to the private<br />
sector are approximately three quarters of the total effects.<br />
5.2 Overview of Recovery and<br />
Reconstruction Needs<br />
The total damage and losses for TC Winston is approximately F$1.99 billion (excluding the environment). Total recovery<br />
and reconstruction costs are estimated at F$1.96 billion (US$0.9 billion). Of this amount, F$0.22 billion (US$0.1 billion) will<br />
focus on recovery needs, F$1.71 billion (US$0.8 billion) will focus on reconstruction and F$31 million (US$14 million) will<br />
focus on resilience activities.<br />
Recovery and reconstruction efforts will initially focus on the most affected sectors, while also ensuring that other affected<br />
sectors are supported.<br />
Table 76 presents the recovery, reconstruction and resilience needs by sector. The majority of the activities are required<br />
in the short to medium term, with the objective of restoring stability to livelihoods and services in the various sectors. The<br />
identification of priority and rehabilitation efforts will be implemented by the relevant government agencies and statutory<br />
bodies with assistance from development partners. The timeframes for these interventions (indicated in Annex 2) are<br />
purely indicative, as institutional arrangements, financial support and other factors will influence the timetables and length<br />
of involvement (please refer to the individual sector assessments within Chapter 3 of this PDNA for further details). Shortterm<br />
needs will be developed further in the DRF. Medium- and long-term needs will be developed further in the National<br />
Development Plan.<br />
Tropical Cyclone Winston, February 20, 2016<br />
119
FIJI Post-Disaster Needs Assessment<br />
Based on damage, losses and identified needs, and in order to promote social, economic, cultural and environmental<br />
wellbeing over the next two years, key recovery and reconstruction needs can be classified around following themes.<br />
<br />
<br />
<br />
<br />
Production Recovery: Includes recovery of production levels in the productive sectors of agriculture, commerce<br />
and manufacturing, mining and tourism.<br />
Service Supply Access Recovery: Focused on recovery of supply and access to basic services of education,<br />
health, housing, transport, communications, water supply and sanitation, and electricity. In particular, the repairing<br />
and rebuilding of housing, and ensuring more resilient and liveable houses will be a priority, through a combination<br />
of government support, household savings, family remittances and local credit.<br />
Personal and Household Income Recovery: Focused on improving the livelihoods of those affected, particularly<br />
those who are vulnerable and below the poverty level.<br />
Reconstruction: Recovery of physical assets, including infrastructure and buildings in adherence to BBB principles.<br />
Repairing and strengthening public infrastructure and buildings, including educational facilities, will be a primary<br />
focus. The repairs, reconstruction and rehabilitation of key infrastructure, such as roads, bridges, seaports and<br />
airports, will enable the delivery of social and economic services to other affected communities and facilitate greater<br />
movement of people, goods and services.<br />
5.2.1 Production Recovery<br />
In each of the productive sectors (i.e., agriculture, manufacturing, trade, tourism and mining), the values of goods that will<br />
not be obtained due to the disruption of production induced by the disaster have been estimated. While such production<br />
losses have in fact vanished from the economy and cannot be replaced, production recovery needs are the amounts of<br />
working capital that producers would require in order to restore pre-disaster production levels.<br />
While different in each productive sector, the need for working capital by the producers is a function of the value of annual<br />
losses sustained due to the disaster. That is, producers need a fraction of the value of their annual production as working<br />
capital. 134 In addition, consideration will be made of any additional and parallel needs involving the possible requirement<br />
to refinance or reschedule (under softer-term loan conditions) pre-disaster loans that producers may have had prior to the<br />
disaster, as well as, in some cases, the potential to provide temporary tax relief to individual and business producers after<br />
the disaster, by lowering taxation rates related to production and sales.<br />
5.2.2 Service Supply and Access Recovery<br />
The value of recovery requirements for the supply of and access to social and infrastructure services (housing, education,<br />
health, transport, communications, electricity, and water and sanitation) includes two possible types: (i) recovery needs by<br />
service providers; and (ii) recovery needs by individual households.<br />
Service recovery requirements by provider enterprises (public or otherwise) refer to the amounts required to cover higher<br />
costs of service operation and provision which have arisen from the disaster. This involves expenditures above the normal<br />
operations budget of the service providers, which are estimated as higher costs of operation in the sectoral assessments<br />
within Chapter 3 of this PDNA. 135 These needs must be met as part of the recovery in order to ensure the providers avoid<br />
using their normal budget resources, since such uses would take away from undertaking normal activities.<br />
Service providers that do not obtain recovery resources to reinforce their financial position may elect to increase tariffs or<br />
rates charged to clients, thereby transferring the higher costs to consumers. In some cases, an alternative solution to this,<br />
in order not to affect further personal or family finances, may be the temporary introduction or increase of government<br />
subsidies for the services in question.<br />
Service recovery requirements at the personal or household level may arise when the enterprise service providers decide to<br />
transfer higher operation costs to the consumers, which would cause an overall higher cost of living for the affected people<br />
and households, thereby leading to a lower quality of life.<br />
134<br />
As an example, farmers require about 18-25 percent of the value of the crop to use as working capital, depending on the specific crop and<br />
varieties.<br />
135<br />
Higher education fees, higher health care costs, temporary housing costs, higher transport costs, electricity and water supply are typical<br />
examples of these increased costs of operation in service provision.<br />
120 Tropical Cyclone Winston, February 20, 2016
FIJI Post-Disaster Needs Assessment<br />
5.2.3 Personal and Household Income Recovery<br />
The value of personal income recovery represents the amounts of income losses sustained by the affected labour force<br />
across all affected sectors of economic activity, formal or informal, as a result of the disaster. These amounts may be used<br />
to define the scope and financial requirements of special “cash-for-work” schemes that may be part of reconstruction.<br />
Consideration will be given to programmes that assist those people and households that would otherwise face income<br />
decline, with special reference to those falling below the poverty level threshold. The cost of such assistance programmes,<br />
including cash-for-work programmes and income-diversification assistance, represents the needs for personal income<br />
recovery.<br />
5.2.4 Reconstruction<br />
The value of reconstruction requirements (also known as physical recovery) has been obtained by estimating the value<br />
of damage for all sectors, and incorporating additional costs that would be required to strengthen resilience, through<br />
improved design and construction standards, or if required the relocation of strategic activities to safer geographical areas<br />
where disaster risk is much lower.<br />
Table 76: Recovery and Reconstruction Needs by Sector<br />
Recovery Reconstruction Resilience Total<br />
Productive Sectors 94.1 173.6 267.7<br />
Agriculture 65.3 96.1 161.4<br />
Commerce and Manufacturing 17.8 43.5 61.3<br />
Tourism 5.0 29.0 34.0<br />
Mining 6.0 5.0 11.0<br />
Social Sectors 12.4 1,261.7 1,274.1<br />
Education 385.9 385.9<br />
Health 12.1 18.8 30.9<br />
Housing 0.3 857.0 857.3<br />
Infrastructure Sectors 15.3 250.7 18.8 284.8<br />
Transport 3.2 174.7 177.9<br />
Water and Sanitation 3.6 20.7 24.3<br />
Electricity 2.1 25.9 5.8 33.8<br />
Communications 6.4 29.4 13.0 48.8<br />
Cross-Cutting Issues 63.0 27.4 12.0 99.7<br />
Environment 60.8 13.1 73.9<br />
Gender 1.6 0.4 2.0<br />
Culture and Heritage 0.6 8.5 9.1<br />
Disaster Risk Management 2.7 12.0 14.7<br />
ELSP 31.5 31.5<br />
Total 216.3 1,713.4 30.8 1,957.8<br />
Source: Estimations by Assessment Team.<br />
Note: A detailed breakdown of needs is included in Annex 2.<br />
Tropical Cyclone Winston, February 20, 2016<br />
121
6.<br />
Family outside their destroyed home. The cyclone blew away the walls and swept away their belongings<br />
Source: Murray Lloyd/UN Women<br />
WAY FORWARD<br />
122<br />
Tropical Cyclone Winston, February 20, 2016
FIJI Post-Disaster Needs Assessment<br />
The recovery needs that were identified during the PDNA process are not linked to the availability or form of recovery<br />
funding, but are driven by the sectoral needs analyses. Given the extent of identified needs and the limited resources, the<br />
first step would be to prioritize the sectors for recovery and reconstruction based on the available financial envelope and<br />
a number of strategic considerations. A criteria-based prioritization of recovery needs across competing sectors will be<br />
necessary, the principles of which could include:<br />
<br />
<br />
<br />
<br />
<br />
<br />
<br />
<br />
<br />
<br />
The recovery programme, while implemented under the government’s leadership, will be carried out in close and<br />
collaborative partnership with international donors, the private sector, civil society and the community as a whole.<br />
6.1 Development of a Disaster Recovery<br />
Framework<br />
The PDNA and similar disaster assessments are an essential component of a successful DRF, which will include: (i)<br />
developing a central vision for recovery; (ii) defining guiding principles; (iii) identifying primary recovery sectors; (iv) assessing<br />
government capacity to manage recovery; (v) appointing an appropriate recovery leader; (vi) establishing appropriate<br />
institutional arrangements; (vii) clarifying institutional roles and responsibilities; and (viii) establishing coordination<br />
mechanisms, conducting funding gap analysis and mobilizing funds.<br />
The DRF will cover immediate and short-term needs identified in this PDNA for the first two years of recovery (2016-2018).<br />
The National Development Plan will cover recovery and reconstruction needs and priorities from two years onwards in the<br />
medium term (2018-2020) and long term (2020 onwards).<br />
Following the first annual results review for the respective flagship programmes conducted by the Ministry of Finance,<br />
in conjunction with line ministries, the required long-term strategies, including policy options, can be reassessed. The<br />
results can then be incorporated into the National Development Plan to guide the programmatic approach, planning,<br />
implementation and monitoring of the medium- and long-term recovery and rehabilitation programmes and projects.<br />
6.2 Institutional and Policy Setup<br />
(including Goods and Services)<br />
Policy and institutional gaps to implementation can cause headaches for agencies involved in recovery in affected<br />
communities. These gaps will need to be identified immediately by the government and addressed to support an efficient<br />
and effective recovery. Currently, there is the need to:<br />
<br />
<br />
<br />
<br />
<br />
<br />
<br />
partners, communities and civil society organizations;<br />
<br />
recovery projects;<br />
<br />
<br />
requires a mix of skills (in particular for procurement, financial management and safeguard requirements) that should<br />
be made available to support the programme’s processes and procedures.<br />
Tropical Cyclone Winston, February 20, 2016<br />
123
Upturned home in Viti Levu<br />
Source: Chris Wensley/ADB<br />
ANNEXES<br />
124<br />
Tropical Cyclone Winston, February 20, 2016
FIJI Post-Disaster Needs Assessment<br />
Annex 1: Detailed Breakdown of Disaster Effects<br />
Table 77: Summary of Damage, Losses and Effects by Sector and Ownership (F$ million)<br />
Damage Losses Total Effects<br />
Public<br />
Ownership<br />
Private<br />
Ownership<br />
Total<br />
Damage<br />
Public<br />
Ownership<br />
Private<br />
Ownership<br />
Total Losses<br />
Public<br />
Ownership<br />
Private<br />
Ownership<br />
Total Effects<br />
Productive 62.9 178.9 241.8 36.7 557.8 594.6 99.7 736.6 836.3<br />
Agriculture 22.0 59.3 81.3 7.6 453.1 460.7 29.6 512.4 542.0<br />
Commerce and Manufacturing 40.9 32.0 72.9 29.1 40.8 69.9 70.1 72.7 142.8<br />
Tourism 76.1 76.1 43.9 43.9 0.0 120.0 120.0<br />
Mining 11.5 11.5 20.0 20.0 0.0 31.5 31.5<br />
Social 76.9 751.0 827.9 25.5 14.5 40.0 102.4 765.5 867.9<br />
Education 69.2 69.2 7.4 0.0 7.4 76.6 0.0 76.6<br />
Health 7.7 7.7 6.2 0.0 6.2 13.9 0.0 13.9<br />
Housing 751.0 751.0 11.9 14.5 26.4 11.9 765.5 777.4<br />
Infrastructure 183.4 24.8 208.2 24.8 15.6 40.4 208.2 40.4 248.6<br />
Transport 126.3 0.8 127.1 0.0 2.4 2.4 126.3 3.2 129.5<br />
Water and Sanitation 16.9 16.9 7.8 0.1 7.9 24.7 0.1 24.8<br />
Electricity 33.0 33.0 8.1 0.0 8.1 41.1 0.0 41.1<br />
Communications 7.2 24.0 31.2 8.9 13.1 22.0 16.1 37.1 53.2<br />
Cross-Cutting Issues 3.3 236.3 239.6 29.6 630.6 660.1 32.9 866.9 899.7<br />
Environment 232.5 232.5 629.8 629.8 0.0 862.3 862.3<br />
Culture 1.3 3.8 5.1 0.1 0.8 0.8 1.4 4.6 5.9<br />
Disaster Risk Management 2.0 2.0 29.5 0.0 29.5 31.5 0.0 31.5<br />
Total 326.5 1,191.0 1,517.5 116.6 1,218.5 1,335.1 443.2 2,409.4 2,852.5<br />
Source: Estimations by Assessment Team.<br />
Tropical Cyclone Winston, February 20, 2016<br />
125
FIJI Post-Disaster Needs Assessment<br />
Table 78: Contribution of Each Sector to Total Damage and Losses<br />
F$ million<br />
Damage Losses Total Effects<br />
Percentage<br />
of Total<br />
Damage<br />
F$ million<br />
Percentage<br />
of Total<br />
Losses<br />
F$ million<br />
Productive 241.8 19% 594.6 84% 836.3<br />
Agriculture 81.3 6% 460.7 65% 542.0<br />
Commerce and Manufacturing 72.9 6% 69.9 10% 142.8<br />
Tourism 76.1 6% 43.9 6% 120.0<br />
Mining 11.5 1% 20.0 3% 31.5<br />
Social 827.9 64% 40.0 6% 867.9<br />
Education 69.2 5% 7.4 1% 76.6<br />
Health 7.7 1% 6.2 1% 13.9<br />
Housing 751.0 58% 26.4 4% 777.4<br />
Infrastructure 208.2 16% 40.4 6% 248.6<br />
Transport 127.1 10% 2.4 0% 129.5<br />
Water and Sanitation 16.9 1% 7.9 1% 24.8<br />
Electricity 33.0 3% 8.1 1% 41.1<br />
Communications 31.2 2% 22.0 3% 53.2<br />
Cross-Cutting Issues 7.1 19% 30.3 0% 37.4<br />
Culture 5.1 0% 0.8 0% 5.9<br />
Disaster Risk Management 2.0 0% 29.5 4% 31.5<br />
Total (Excluding Environment) 1,285.0 100% 705.3 100% 1,990.2<br />
Source: Estimations by Assessment Team.<br />
Table 79: Summary of Damage by Ownership<br />
Public Ownership Private Ownership Total Damage<br />
F$ million<br />
Percentage<br />
of Total<br />
Public<br />
Damage<br />
F$ million<br />
Percentage<br />
of Total<br />
Private<br />
Damage<br />
F$ million<br />
Productive 62.9 19% 178.9 19% 241.8<br />
Agriculture 22.0 7% 59.3 6% 81.3<br />
Commerce and Manufacturing 40.9 13% 32.0 3% 72.9<br />
Tourism 76.1 8% 76.1<br />
Mining 11.5 1% 11.5<br />
Social 76.9 24% 751.0 78% 827.9<br />
Education 69.2 21% 69.2<br />
Health 7.7 2% 7.7<br />
Housing 0% 751.0 78% 751.0<br />
Infrastructure 183.4 56% 24.8 3% 208.2<br />
Transport 126.3 39% 0.8 0% 127.1<br />
Water and Sanitation 16.9 5% 16.9<br />
Electricity 33.0 10% 33.0<br />
Communications 7.2 2% 24.0 3% 31.2<br />
Cross-Cutting Issues 3.3 1% 3.8 0% 7.1<br />
Culture 1.3 0% 3.8 0% 5.1<br />
Disaster Risk Management 2.0 1% 2.0<br />
Total (Excluding Environment) 326.5 100% 958.5 100% 1,285.0<br />
Source: Estimations by Assessment Team.<br />
126 Tropical Cyclone Winston, February 20, 2016
FIJI Post-Disaster Needs Assessment<br />
Table 80: Summary of Losses by Ownership<br />
Public Ownership Private Ownership Total Losses<br />
F$ million<br />
Percentage<br />
of Total<br />
Public<br />
Losses<br />
F$ million<br />
Percentage<br />
of Total<br />
Private<br />
Losses<br />
F$ million<br />
Productive 36.7 32% 557.8 95% 594.6<br />
Agriculture 7.6 7% 453.1 77% 460.7<br />
Commerce and Manufacturing 29.1 25% 40.8 7% 69.9<br />
Tourism 43.9 7% 43.9<br />
Mining 20.0 3% 20.0<br />
Social 25.5 22% 14.5 2% 40.0<br />
Education 7.4 6% 0% 7.4<br />
Health 6.2 5% 0% 6.2<br />
Housing 11.9 10% 14.5 2% 26.4<br />
Infrastructure 24.8 21% 15.6 3% 40.4<br />
Transport 2.4 0% 2.4<br />
Water and Sanitation 7.8 7% 0.1 0% 7.9<br />
Electricity 8.1 7% 8.1<br />
Communications 8.9 8% 13.1 2% 22.0<br />
Cross-Cutting Issues 29.6 25% 0.8 0% 30.3<br />
Culture 0.1 0% 0.8 0% 0.8<br />
Disaster Risk Management 29.5 25% 29.5<br />
Total (Excluding Environment) 116.6 100% 588.7 100% 705.3<br />
Source: Estimations by Assessment Team.<br />
Table 81: Summary of Total Effects by Ownership<br />
Public Ownership Private Ownership Total Effects<br />
F$ million<br />
Percentage<br />
of Total<br />
Public<br />
Effects<br />
F$ million<br />
Percentage<br />
of Total<br />
Private<br />
Effects<br />
F$ million<br />
Productive 99.7 22% 736.6 48% 836.3<br />
Agriculture 29.6 7% 512.4 33% 542.0<br />
Commerce and Manufacturing 70.1 16% 72.7 5% 142.8<br />
Tourism - 0% 120.0 8% 120.0<br />
Mining - 0% 31.5 2% 31.5<br />
Social 102.4 23% 765.5 49% 867.9<br />
Education 76.6 17% - 0% 76.6<br />
Health 13.9 3% - 0% 13.9<br />
Housing 11.9 3% 765.5 49% 777.4<br />
Infrastructure 208.2 47% 40.4 3% 248.6<br />
Transport 126.3 28% 3.2 0% 129.5<br />
Water and Sanitation 24.7 6% 0.1 0% 24.8<br />
Electricity 41.1 9% - 0% 41.1<br />
Communications 16.1 4% 37.1 2% 53.2<br />
Cross-Cutting Issues 32.9 7% 4.5 0% 37.4<br />
Culture 1.4 0% 4.6 0% 5.9<br />
Disaster Risk Management 31.5 7% -0.0 0% 31.5<br />
Total (Excluding Environment) 443.2 100% 1,547.0 100% 1,990.2<br />
Source: Estimations by Assessment Team.<br />
Tropical Cyclone Winston, February 20, 2016<br />
127
FIJI Post-Disaster Needs Assessment<br />
Table 82: Summary of Total Effects by Public Ownership<br />
128 Tropical Cyclone Winston, February 20, 2016<br />
Public Sector Damage<br />
F$ million<br />
Percentage of<br />
Total Public<br />
Sector Damage<br />
Public Sector Loss<br />
F$ million<br />
Percentage of<br />
Total Public<br />
Sector Damage<br />
Losses<br />
Total Public<br />
Sector Effects<br />
F$ million<br />
Productive 62.9 19% 36.7 32% 99.7<br />
Agriculture 22.0 7% 7.6 7% 29.6<br />
Commerce and Manufacturing 40.9 13% 29.1 25% 70.1<br />
Tourism<br />
Mining<br />
Social 76.9 24% 25.5 22% 102.4<br />
Education 69.2 21% 7.4 6% 76.6<br />
Health 7.7 2% 6.2 5% 13.9<br />
Housing 11.9 10% 11.9<br />
Infrastructure 183.4 56% 24.8 21% 208.2<br />
Transport 126.3 39% 126.3<br />
Water and Sanitation 16.9 5% 7.8 7% 24.7<br />
Electricity 33.0 10% 8.1 7% 41.1<br />
Communications 7.2 2% 8.9 8% 16.1<br />
Cross-Cutting Issues 3.3 1% 29.6 25% 32.9<br />
Culture 1.3 0% 0.1 0% 1.4<br />
Disaster Risk Management 2.0 1% 29.5 25% 31.5<br />
Total (Excluding Environment) 326.5 100% 116.6 100% 443.2<br />
Source: Estimations by Assessment Team.<br />
Table 83: Summary of Total Effects by Private Ownership<br />
Private Sector Damage<br />
F$ million<br />
Percentage of<br />
Total Private<br />
Sector Damage<br />
Private Sector Loss<br />
F$ million<br />
Percentage of<br />
Total Private<br />
Sector Damage<br />
Losses<br />
Total Private<br />
Sector Effects<br />
F$ million<br />
Productive 178.9 19% 557.8 95% 736.6<br />
Agriculture 59.3 6% 453.1 77% 512.4<br />
Commerce and Manufacturing 32.0 3% 40.8 7% 72.7<br />
Tourism 76.1 8% 43.9 7% 120.0<br />
Mining 11.5 1% 20.0 3% 31.5<br />
Social 751.0 78% 14.5 2% 765.5<br />
Education<br />
Health<br />
Housing 751.0 78% 14.5 2% 765.5<br />
Infrastructure 24.8 3% 15.6 3% 40.4<br />
Transport 0.8 0% 2.4 0% 3.2<br />
Water and Sanitation 0.1 0% 0.1<br />
Electricity<br />
Communications 24.0 3% 13.1 2% 37.1<br />
Cross-Cutting Issues 3.8 0% 0.8 0% 4.5<br />
Culture 3.8 0% 0.8 0% 4.6<br />
Disaster Risk Management<br />
Total (Excluding Environment) 958.5 100% 588.7 100% 1,547.0<br />
Source: Estimations by Assessment Team.
Malake landing, Ra, Viti Levu<br />
Source: Vlad Sokhin/World Bank<br />
129
FIJI Post-Disaster Needs Assessment<br />
Annex 2: Detailed Breakdown of Recovery<br />
Needs by Sector<br />
Recovery and Reconstruction Needs for Agriculture<br />
Table 84: Recovery and Reconstruction Needs for Agriculture<br />
Activity<br />
Responsible Agency<br />
Cost<br />
(F$ million)<br />
Total Recovery and Reconstruction Needs 161.4<br />
Recovery Needs<br />
Crops<br />
Immediate response from the MoA MoA 1.8<br />
Provision of seeds, seedlings, suckers, cuttings and other agricultural inputs for replanting<br />
of crops, market rehabilitation<br />
Temporary provision of food ration to most affected population<br />
FAO/UNWomen/UNDP/<br />
Ramakrishna/L&L Care<br />
NGOs (PLAN INT/PCDF,<br />
MSP, DFAT)<br />
Monitoring and evaluation of TC Winston response, agriculture sector MoA, Donors 0.5<br />
Land clearance support with cash-for-work activity UNDP, ILO 0.1<br />
Advisory support, communications support, CCA-DRM support (MoA post) UNDP - PRRP 0.2<br />
Provision of agro-inputs, land clearance MoA, Donors 6.4<br />
Provision of improved varieties of seeds for coconunt (existing variety - <strong>Fiji</strong> Tall), cocoa,<br />
dalo and yaqona, including tissue culture mass propagation. Establish tissue culture,<br />
mass propogation centres to build capacity. Expand existing and establish new<br />
capacity.<br />
Plant protection mechanisms - pest and disease diagnostics and management (e.g.,<br />
groud trapping/biological control)<br />
Soil testing for land areas damaged by the cyclone (bleaching, soil erosion, storm<br />
surge) and supporting land rehabilitation including training<br />
0.6<br />
0.02<br />
MoA and Donors 8<br />
FAO and Donors 2<br />
Donors and FAO 4<br />
Technical assistance for the finalisation of a <strong>Fiji</strong> farmers (crop & livestock) baseline SPC, FAO, MoA, Donors 1.2<br />
Development of a national disaster assessment system for crop and livestock, MoA and Donors 0.1<br />
Provision of disaster resilient crops (tivoli, via, dalo ni tana, taro) MoA and FAO 1<br />
Development of an agriculture value chain management strategy MoA 2<br />
Support sustainable disaster mitigation-oriented land management programme MoA 0.5<br />
Promotion of smal scale income generating organic and back yard farming systems MoA 0.5<br />
Food security and economic recovery campaign (awareness) MoA 0.2<br />
Setting up a reliable disaster communication system (sat phones, solar power sources)<br />
for inaccessible areas (e.g. Lau group)<br />
Establishment of community nurseries (model farms & knowledge hubs, aligning<br />
existing work with Govt/NGOs)<br />
Sugar Cane<br />
MoA and Donors 1.3<br />
NGOs (CARE/L&L) 0.2<br />
Emergency actions through the sugar sector GoF, MOS, SCGC, FCU 3.8<br />
Farmers' support services enhancement SRIF, SPF 0.8<br />
Capacity building MOS/sugar sector for immediate recovery support MOS 0.1<br />
Cane recovery programme for farmers MOS, EU-AMSP, GoF 5.1<br />
Farmers' support services enhancement SRIF, SPF 1<br />
Capacity building MOS/sugar sector for medium to long term support MOS 1.5<br />
Livestock<br />
Distribution of veterinary drugs, feeds, fertilizers, seeds for pasture, feed for apiculture MoA 0.4<br />
Restocking, biosecurity livestock support, including provision of day old chicks and<br />
poultry feed<br />
MoA & FAO 0.2<br />
130 Tropical Cyclone Winston, February 20, 2016
FIJI Post-Disaster Needs Assessment<br />
Activity<br />
Responsible Agency<br />
Cost<br />
(F$ million)<br />
Monitoring and evaluation of TC Winston response, livestock sector, including training Donors 0.1<br />
Establishment of new small scale village level livestock projects in most affected areas Donors and MoA 0.5<br />
Fisheries<br />
Immediate needs packages of fisheries and aquaculture materials FAO 0.2<br />
Training on boat, motor, fishing gear repair and sustainable fishing practices FAO and Donors 0.1<br />
Distribution of materials for repair, or complete replacement of boats, motors and<br />
fishing gear, and premix vouchers<br />
FAO and Donors 1<br />
Rapid re-deployment of FADs and training in FAD fishing and sea safety FAO, SPC, ADB, NZ Govt 0.4<br />
Assessment of coral reef impacts and recovery, to support management of fisheries<br />
and coastal development<br />
Donors 0.2<br />
Strengthen community-based fisheries management in a post-disaster context Donors 0.1<br />
Distribution of fish feed supplies and farm materials to small-scale aquaculture farms FAO 0.1<br />
Establish temporary hatcheries and staff accommodation to start immediate fish farm<br />
restocking programs<br />
Restore small-scale aquaculture farms: provide materials to repair ponds and<br />
hatcheries, clean debris (cash for work)<br />
Provide capacity building to small-scale fish farmers in simple methods for on-farm fish<br />
fingerling production<br />
Provide guidelines for aquaculture biosecurity issues related to cyclone recovery work,<br />
e.g. import of live aquatic species<br />
Management support for fisheries managers and communities in a post-disaster<br />
context<br />
Training of fishers, gleaners and harvesters, fish farmers on disaster preparedness and<br />
resilience<br />
Assessment of coral reef impacts and recovery to support management of fisheries &<br />
coastal development<br />
Strategies to increase visibility of non-licensed fisheries sector in fisheries management<br />
and disaster responses<br />
Medium- and long-term monitoring of cyclone impacts on food security, CPUEs,<br />
livelihoods, etc.<br />
On-going deployment of FADs, establishment of FAD infrastructure and teams, training<br />
for fishers in FAD fishing and sea safety<br />
Increase resilience of aquaculture hatcheries, brood stock holding facilities, and<br />
aquaculture infrastructure to withstand future natural disasters<br />
Department of Fisheries<br />
(DoF)<br />
0.5<br />
FAO 0.1<br />
FAO 0.1<br />
DoF 0<br />
DoF and Donors 0.8<br />
DoF and Donors 0.2<br />
DoF and Donors 4.2<br />
DoF and Donors 0.1<br />
DoF and Donors 2<br />
DoF and Donors 2.2<br />
DoF and Donors 5<br />
Support rehabilitation of pearl farms affected by TC Winston Donors 0.2<br />
Spread out risk of disaster to hatcheries by fostering on-farm fish fingerling production DoF and Donors 0.1<br />
Assess TC Winston impacts on technical and economic viability of <strong>Fiji</strong>'s leading<br />
aquaculture production sectors<br />
Forestry<br />
DoF and Donors 0.5<br />
Propping up of windblown trees Private companies 0.1<br />
Removing fallen trees Private sector, DoF 0.3<br />
Supply of seedlings DoF, SPC/EU 1<br />
Supply of seeds<br />
Maintenance of rehabilitated areas<br />
Donors, Private companies,<br />
DoF<br />
Donors, Communities,<br />
Private companies<br />
Total Recovery Needs 65.3<br />
Reconstruction Needs<br />
Crops<br />
Input support to enablers (agriculture extension stations): tents, computers, printers UNDP-PRRP/R2R, DFAT 0.1<br />
Land clearance support through contractors, purchase of chainsaws MoA 2<br />
0.5<br />
1.4<br />
Tropical Cyclone Winston, February 20, 2016<br />
131
FIJI Post-Disaster Needs Assessment<br />
Activity<br />
Responsible Agency<br />
Cost<br />
(F$ million)<br />
Purchase/hire of farm machinery and tools MoA 1<br />
Provision of virgin coconut press, including training and market establishment MoA and Donors 0.5<br />
Provision of Farm tools (fork, knives, knapsack sprayer) MoA and FAO 0.6<br />
Repairs and maintenance of private and public nurseries MoA 0.3<br />
Provision of farm tools ILO 0.01<br />
Rehabilitation of nurseries with innovative materials to enable nurseries to sustain<br />
further disasters (e.g. removable nurseries with storage facilities)<br />
MoA and FAO 0.3<br />
Set up on-farm nursery at strategic locations (extension and farmers) MoA and FAO 0.04<br />
Purchase/hire of farm machinery and tools MoA 1.5<br />
Provision of backup power source (solar) MoA 0.8<br />
Land clearance MoA 2<br />
Provision of farm tools (fork, knives, knapsack sprayer) FAO 0.1<br />
Rehabilitation of drainage, seawalls, farm roads MoA and Donors 0.3<br />
Sugar cane<br />
Cane seed replanting for farmers MOS, EU-AMSP, GoF 2<br />
Sugar and farm roads GoF and Donors 0.6<br />
Farm sheds and stores rehabilitation GoF and Donors 2.7<br />
Cane harvest labour gang asset restoration MOS 1.1<br />
Sea bunds and major drainage systems MoA/Drainage boards 0.6<br />
Cane harvest labour gang asset restoration MOS 1.1<br />
Sugar and farm roads GoF and Donors 1.8<br />
Cane seed replanting for farmers MOS, EU-AMSP, GoF 9.5<br />
Sea bunds and major drainage systems MoA/Drainage boards 9.4<br />
Livestock<br />
Distribution of fencing materials and roofing iron and syringes MoA and FAO 0.7<br />
Distribution of bee frames and wax MoA 0.1<br />
Purchase of equipment, including water tanks, generator, chains MoA 0.3<br />
Replacement of stock (including beehives) Donors 2.9<br />
Rehabilitation of infrastructure (shed) using disaster resilient standards Donors 4.1<br />
Replacement of feed and fodder Donors 0.3<br />
Replacement of machineries and equipment (fencing, roofing, solar lighting system<br />
and mistblowers)<br />
Donors 1<br />
Rehabilitation of farm roads MoA and Donors 0.1<br />
Forestry<br />
Rehabilitation/replacement of assets (portable mills, nurseries, machineries, sawmills,<br />
sheds, solar panels)<br />
Replanting of trees<br />
Fisheries<br />
Donors 0.6<br />
Donors, Communities,<br />
Private companies<br />
Replacement of pearl farm assets (seeding houses, jetties, etc.) Donors 0.4<br />
Reconstruction of fisheries and aquaculture infrastructure: private sector<br />
Reconstruction of fisheries and aquaculture infrastructure: DoF ice plants, hatcheries,<br />
staff quarters, etc.<br />
DoF, Private sector and<br />
Donors<br />
0.6<br />
42<br />
DoF and Donors 4.7<br />
Total Reconstruction Needs 96.1<br />
Source: Estimations by Assessment Team.<br />
132 Tropical Cyclone Winston, February 20, 2016
FIJI Post-Disaster Needs Assessment<br />
Table 85: Recovery and Reconstruction Needs for Commerce and Manufacturing<br />
Activity<br />
Responsible Agency<br />
Cost<br />
(F$ million)<br />
Total Recovery and Reconstruction Needs 61.3<br />
Recovery Needs 17.8<br />
Commerce 2.0<br />
Manufacturing, excluding sugar Ministry of Agriculture/ Development partners 2.0<br />
Sugar industry (less insurance) <strong>Fiji</strong> Sugar Corporation 10.7<br />
SMEs MITT / NCSMED/Development partners 2.6<br />
Cooperatives Cooperative members/ MITT/Development partners 0.5<br />
Reconstruction Needs 43.5<br />
Commerce subsector 0.9<br />
Manufacturing subsector, excluding sugar Ministry of Agriculture/Development partners 7.4<br />
Sugar industry (less insurance) <strong>Fiji</strong> Sugar Corporation 31.4<br />
SMEs MITT / NCSMED/Development partners 3.0<br />
Cooperatives Cooperative members/ MITT/Development partners 0.8<br />
Source: Estimations by Assessment Team.<br />
Table 86: Recovery and Reconstruction Needs for Tourism<br />
Activity<br />
Responsible Agency<br />
Cost<br />
(F$ million)<br />
Total Recovery and Reconstruction Needs 34.0<br />
Recovery Needs 5.0<br />
Marketing – immediate info campaign Tourism <strong>Fiji</strong>, and individual hotels/resorts and tourism operators 1.0<br />
Marketing – destination confidence campaign Tourism <strong>Fiji</strong>, and individual hotels/resorts and tourism operators 2.0<br />
Import duty waivers for reconstruction materials Ministry of Finance, individual hotels/resorts and tourism operators 2.0<br />
Reconstruction Needs 29.0<br />
Reconstruction (F$83.9 million, less F$54.8<br />
million insurance)<br />
Source: Estimations by Assessment Team.<br />
Table 87: Recovery and Reconstruction Needs for Mining<br />
Activity<br />
Individual hotels/resorts and tourism operators 29.0<br />
Responsible Agency<br />
Cost<br />
(F$ million)<br />
Total Recovery and Reconstruction Needs 11.0<br />
Recovery Needs 6.0<br />
Recovery of lost revenue by increasing gold production (VGM) VMG 6.0<br />
Reconstruction Needs 5.0<br />
Maintenance/repair of buildings and infrastructure (insurance excess) VMG 5.0<br />
Source: Estimations by Assessment Team.<br />
Table 88: Recovery and Reconstruction Needs for Education<br />
Activity<br />
Responsible Agency<br />
Cost<br />
(F$ million)<br />
Total Recovery and Reconstruction Needs 385.9<br />
Recovery Needs .007<br />
Travel costs associated with counselling MOE .007<br />
Reconstruction Needs 385.9<br />
Replacement of education materials MOE 8.3<br />
Design construction and project management MOE 348.9<br />
Furniture and equipment MOE 28.7<br />
Source: Estimations by Assessment Team.<br />
Tropical Cyclone Winston, February 20, 2016<br />
133
FIJI Post-Disaster Needs Assessment<br />
Table 89: Recovery and Reconstruction Needs for Health<br />
Activity<br />
Responsible Agency<br />
Cost<br />
(F$ million)<br />
Total Recovery and Reconstruction Needs 30.9<br />
Recovery Needs 12.1<br />
Additional drugs and supplies drugs and supplies MoHMS/Development partners 3.6<br />
Additional laboratory chemicals and reagents MoHMS/Development partners 1.4<br />
Psychosocial services MoHMS/Development partners 1.3<br />
Mental health strengthening MoHMS/Development partners 0.1<br />
Health promotion and outreach programmes including mobile clinics MoHMS/Development partners 2.1<br />
Vector control MoHMS 1.6<br />
Nutrition MoHMS/Development partners 0.8<br />
Disaster/Climate change contingency funding (health) MoHMS/Development partners 0.3<br />
Human resource personnel MoHMS/Development partners 0.7<br />
Strengthening workforce capacity for disaster response and recovery MoHMS/Development partners 0.2<br />
Reconstruction Needs 18.8<br />
Repairs and maintenance MoHMS/Development partners 0.9<br />
Rehabilitation of facilities MoHMS/Development partners 0.9<br />
Reconstruction of facilities MoHMS/Development partners 3.6<br />
Relocation of medical facilities MoHMS/Development partners 11.3<br />
Procurement of non-medical equipment MoHMS/Development partners 1<br />
Procurement and repairs of non-medical equipment MoHMS/Development partners 0.4<br />
Replacement for damaged drugs and supplies MoHMS/Development partners 0.1<br />
Medical equipment MoHMS/Development partners 0.3<br />
Cold chain equipment MoHMS/Development partners 0.3<br />
Source: Estimations by Assessment Team.<br />
Table 90: Recovery and Reconstruction Needs for Housing<br />
Activity<br />
Total Recovery and Reconstruction Needs<br />
Responsible Agency<br />
Cost<br />
(F$ million)<br />
Recovery Needs 0.3<br />
Establish Public-Private Housing Reconstruction Steering Committee MoF/MLGHE/FIE/FIA/ Civil Society 0.1<br />
Construction Implementation Unit (CIU policy and overall coordination) MoF/MLGHE/<strong>Fiji</strong> Consulting industry 0.2<br />
Reconstruction Needs 857.0<br />
Management Information System, M&E MoF/MLGHE 0.5<br />
Expert Advisory Groups MoF/MLGHE/FIE/FIA/HfHF/MTCT 0.3<br />
Dept of Social Welfare eligibility vetting, identifying needy people MWCPA/<strong>Fiji</strong> Consulting Industry 0.5<br />
MoIT/MR&M/MiTA & sub-contractors to establish provincia hubs with mobile<br />
units (building and social)<br />
Prepare multi-year communications plan (how to apply, elgibility, standard to<br />
build to, how to access advice)<br />
MoF/MoIT/MRMD&NDMO/MLGHE/<br />
<strong>Fiji</strong> Consulting Industry<br />
10.1<br />
CIU 0.1<br />
"8-point Build Safer" flyer market saturation CIU 0.8<br />
Monthly dissemination of key messages CIU 2.2<br />
Training Dept. Social Welfare officers on elgibility criteria and follow up advice<br />
to be provided to hhds<br />
Training MoIT staff and sub-contractors on damage assessments, advising<br />
hhds on repair priorities<br />
Review and update building code and include 'deemed to comply' materials<br />
standards and specs for critical building elements affordable by low income<br />
hhds<br />
CIU/MWCPA 0.4<br />
MoIT/MRMD/NDMO/MiTA 0.4<br />
MLGHE 0.5<br />
134 Tropical Cyclone Winston, February 20, 2016
FIJI Post-Disaster Needs Assessment<br />
Activity<br />
Responsible Agency<br />
Cost<br />
(F$ million)<br />
Professional development training of building inspectors MoIT/MoH/MLGHE 1.8<br />
House addressing system in affected cane farming areas MoS/ FSCL 0.2<br />
House addressing system in affected peri-urban informal settlements MLGHE/MoL/PCN 0.2<br />
Replace minimum household goods and school uniform (destroyed houses<br />
only)<br />
Prepare and pre-approve 4-6 'model' houses (one room starter that can be<br />
incrementally expanded over many years) with materials list and specifications<br />
for voluntary uptake by hhds<br />
Reconstruct 11,030 to starter house/core unit<br />
Reconstruct 11,030 to build back better standards<br />
Initial repairs to critical elements (partial roof) of major damage houses<br />
Initial repairs to critical elements (partial roof) of minor damage houses<br />
MOF/Individual Households/FNPF 53.8<br />
MoIT/MLGHE/MRMD&NDMO/<br />
HfHF/MTCT (Rotahomes)/FIE/MRH<br />
MoIT/MLGHE/MRMD/NDMO/<br />
Individual Households<br />
MoIT/MLGHE/MRMD/NDMO/<br />
Individual Households<br />
MoIT/MLGHE/MRMD/NDMO/<br />
Individual Households<br />
MoIT/MLGHE/MRMD/NDMO/<br />
Individual Households<br />
30,369 household repairs toolkit GoF with support from NGOs and<br />
Donors<br />
Prepare and pre-approve 2 wet area designs with materials lists and specs<br />
GoF with support from Development<br />
partners<br />
Reconstruct 11,030 water and shower units MoH/MRMD/NDMO/households 36.2<br />
Transportation to Viti Levu GoF 1.2<br />
Transportation to Vanua Levu GoF 1.2<br />
Transportation to Maritime islands GoF 1.0<br />
Source: Estimations by Assessment Team.<br />
Table 91: Recovery and Reconstruction Needs for Transport<br />
Activity<br />
Responsible Agency<br />
0.1<br />
77.2<br />
490.6<br />
26.9<br />
135.6<br />
13.2<br />
0.1<br />
Cost<br />
(F$ million)<br />
Total Recovery and Reconstruction Needs 177.9<br />
Recovery Needs 3.2<br />
Restoring full access and connectivity through affected road sections FRA 2.8<br />
Salvage grounded vessels Private sector 0.3<br />
Clear debris from runways and rebuild security fences AFL 0.05<br />
Reconstruction Needs 174.7<br />
Reconstruction of bridges, crossings, culverts, and approaches. Repair of<br />
associated facilities.<br />
FRA 131.2<br />
Reconstruction of rural jetties FRA 37.0<br />
Repair of aids to navigation MSAF 2.3<br />
Repair of port terminal buildings FPCL 0.8<br />
Repair of airport terminal buildings AFL 3.4<br />
Source: Estimations by Assessment Team.<br />
Tropical Cyclone Winston, February 20, 2016<br />
135
FIJI Post-Disaster Needs Assessment<br />
Table 92: Recovery and Reconstruction Needs for Water and Sanitation<br />
Activity<br />
Responsible Agency<br />
Cost<br />
(F$ million)<br />
Total Recovery and Reconstruction Needs 24.3<br />
Recovery Needs 3.6<br />
Repair or buy new water storage tanks, fees for carting, water monitoring and<br />
testing, rural water schemes<br />
Urban waste disposal costs, upgrade waste water treatment plants (add<br />
mechanical screens)<br />
WAF 1.1<br />
City Councils 2.2<br />
Purchase generator sets WAF 0.3<br />
Strengthen institutional capacity in sector, including provision of experienced<br />
advisor with technical expertise of water treatment in the strategic planning<br />
department in WAF, review of tariff, preparation of water and waste<br />
management plans<br />
WAF 0.04<br />
Reconstruction Needs 20.7<br />
Water<br />
Repair of WAF assets WAF 6.8<br />
Repair of rural water schemes WAF 0.2<br />
Have experienced advisor with engineering expertise of water treatment in the<br />
strategic planning department in WAF<br />
WAF/Development partners 0.2<br />
Reconstruction of WAF assets WAF 9.4<br />
Reconstruction of rural water schemes WAF 2.6<br />
Provide microbiological testing facilities in every urban drinking water treatment<br />
plant<br />
MoH/WAF 0.1<br />
Repair or buy new water storage tanks WAF 0.9<br />
Repair of EPS DWS < 0.1<br />
Issue annual water quality monitoring plan & report MoH/WAF < 0.1<br />
Review tariff so that contingency costs can be covered at minimum WAF/Development partners < 0.1<br />
Comprehensive management plan together with environmental water use WAF/Development partners < 0.1<br />
Sanitation<br />
Reconstruction of WAF assets WAF < 0.1<br />
Upgrade WWTPs (add mechanical screen) WAF 0.1<br />
Comprehensive waste management plan incorporating feasibility study for<br />
incineration<br />
Solid waste<br />
MLGHE < 0.1<br />
Build transfer stations MLGHE/City Councils 0.4<br />
Source: Estimations by Assessment Team.<br />
Table 93: Recovery, Reconstruction and Resilience Needs for Electricity<br />
Activity<br />
Total Recovery and Reconstruction Needs<br />
Responsible Agency<br />
Cost<br />
(F$ million)<br />
Recovery Needs 2.1<br />
Communications FEA 2.0<br />
Property FEA 0.1<br />
Reconstruction Needs 25.9<br />
Generation FEA 1.8<br />
Transmission FEA 6.7<br />
Distribution and retail FEA 17.4<br />
Resilience Needs 5.8<br />
Rural mini grids and stand-alone solar systems FEA 5.8<br />
Source: Estimations by Assessment Team.<br />
136 Tropical Cyclone Winston, February 20, 2016
FIJI Post-Disaster Needs Assessment<br />
Table 94: Recovery and Reconstruction Needs for Communications<br />
Activity<br />
Responsible Agency<br />
Cost<br />
(F$ million)<br />
Total Recovery and Reconstruction Needs 48.8<br />
Recovery Needs 6.4<br />
Urgent rehabilitation of communication towers and equipment<br />
Repair/replacement of damaged infrastructure and equipment<br />
Vodafone, Digicel, TV and radio<br />
broadcasters<br />
TFL, with assistance from<br />
government and donor agencies<br />
Reconstruction Needs 29.4<br />
Replacement of damaged stock and urgent building repairs and maintenance Post <strong>Fiji</strong> 0.1<br />
Repair/replacement of damaged infrastructure and equipment<br />
Vodafone, Digicel, TFL, with<br />
assistance from government and<br />
donor agencies<br />
Resilience Needs 13.0<br />
Complete fiber ring around Viti Levu to provide redundancy to existing<br />
infrastructure<br />
Establish a second redundant link from Viti Levu to Vanua Levu through<br />
Lomaiviti<br />
TFL, with assistance from<br />
government and donor agencies<br />
TFL, with assistance from<br />
government and donor agencies<br />
Build CAT3/ 4 resilient heavy duty guyed masts (45 metres) at remote sites Digicel 5.3<br />
Build CAT4 resilient bunkers to house transmission equipment. CFL 0.1<br />
Source: Estimations by Assessment Team.<br />
Table 95: Recovery and Reconstruction Needs for the Environment<br />
Activity<br />
Responsible Agency<br />
4.5<br />
1.9<br />
29.3<br />
5.6<br />
2.0<br />
Cost<br />
(F$ million)<br />
Total Recovery and Reconstruction Needs 73.9<br />
Recovery Needs 60.8<br />
Control of Invasive African Tulip GoF/NGOs/Development partners 10.1<br />
Strengthening and enforcement of planning and environmental legislative and<br />
institutional frameworks (through budget arty support from donors) including<br />
native forest areas adjoining to the cyclone damaged coral reefs<br />
Use of Fish Aggregated Devices (FDAs)<br />
Operational cost for the management of existing protected areas & reserves<br />
(coral reef, mangrove and native forest).<br />
Increased cost of ecological surveys, damage assessment, monitoring and<br />
recovery of ecosystem assets and establishing a centralised database)<br />
Ministry of Fisheries and Forest/<br />
NGOs/Development partners<br />
Ministry of Fisheries and Forest/<br />
NGOs/Development partners<br />
5.0<br />
0.9<br />
GoF/NGOs/Development partners 3.0<br />
GoF/NGOs/Development partners 8.2<br />
Clearance of debris in cities and villages MLGHE 13.9<br />
Clearance of debris from agricultural land MoA 14.2<br />
Special treatment for potentially recyclable / reusable material MLGHE 4.5<br />
Special treatment for potentially hazardous waste GoF/MLGHE 1.0<br />
Reconstruction Needs 13.1<br />
Replanting of mangroves GoF 1.8<br />
Assisting recovery of coral reefs through transplants and protection using the<br />
techniques used by the privates sector (hotel and coral export industry)<br />
Waste processing equipment (cost of compactor and shredders) with<br />
locations aligned with proposed waste transfer stations to avoid expansion<br />
of waste sites – strengthen recycle/reuse. (Year two costs are based on<br />
government operational cost of 40%)<br />
Source: Estimations by Assessment Team.<br />
GoF/NGOs/Development partners 4.7<br />
MLGHE/Development partners 6.6<br />
Tropical Cyclone Winston, February 20, 2016<br />
137
FIJI Post-Disaster Needs Assessment<br />
Table 96: Recovery and Reconstruction Needs for Gender and Social Inclusion<br />
Activity<br />
Responsible Agency<br />
Cost<br />
(F$ million)<br />
Total Recovery and Reconstruction Needs 2.0<br />
Recovery Needs 1.6<br />
Skills development, training and market development<br />
Consultations documentation and registration of vulnerable groups<br />
Strengthening services and referral systems for prevention of SGBV<br />
Psychosocial support to children and community members<br />
Support for the elderly, PLWD, and child protection<br />
Reconstruction and rehabilitation of 9 Women Resource Centres<br />
Gender Recovery Monitoring and Evaluation<br />
Ministry of Women, Children and Poverty<br />
Alleviation/Development partners<br />
Ministry of Women, Children and Poverty<br />
Alleviation/Development partners<br />
Ministry of Women, Children and Poverty<br />
Alleviation/Development partners<br />
Ministry of Women, Children and Poverty<br />
Alleviation/MoHMS/Development partners<br />
Ministry of Women, Children and Poverty<br />
Alleviation/MoHMS/Development partners<br />
Ministry of Women, Children and Poverty<br />
Alleviation /Development partners<br />
Ministry of Women, Children and Poverty<br />
Alleviation /Development partners<br />
Reconstruction Needs 0.4<br />
Reconstruction and rehabilitation of nine women resource centres<br />
Gender recovery monitoring and evaluation<br />
Source: Estimations by Assessment Team.<br />
Table 97: Recovery and Reconstruction Needs for Culture and Heritage<br />
Activity<br />
Ministry of Women, Children and Poverty<br />
Alleviation /Development partners<br />
Ministry of Women, Children and Poverty<br />
Alleviation /Development partners<br />
Responsible Agency<br />
0.35<br />
0.07<br />
0.70<br />
0.05<br />
0.14<br />
0.18<br />
0.15<br />
0.20<br />
0.20<br />
Cost<br />
(F$ million)<br />
Total Recovery and Reconstruction Needs 9.1<br />
Recovery Needs 0.6<br />
Emergency salvaging of heritage fixtures and materials (Makogai<br />
Island)<br />
Emergency technical assessment/mission of extent of damage and<br />
appropriate repair methodology including recovery efforts<br />
Inventory of intangible cultural heritage in Navala<br />
Immediate capacity building of traditional architectural skills (Navala)<br />
and basic conservation timber and stone architectural knowledge<br />
(Levuka)<br />
Immediate rehabilitation of damaged repositories of heritage<br />
Immediate full assessment of status of intangible cultural heritage<br />
element mapped<br />
Skills and product development workshop for visual, craft and<br />
heritage practitioners using recyclable materials<br />
Development and implementation of DRR plan for all cultural<br />
domains<br />
Ministry of iTaukei Affairs, National Trust of <strong>Fiji</strong>/<br />
Development partners<br />
Ministry of iTaukei Affairs, National Trust of <strong>Fiji</strong>/<br />
Development partners<br />
Ministry of iTaukei Affairs, National Trust of <strong>Fiji</strong>/<br />
Development partners<br />
Ministry of iTaukei Affairs, National Trust of <strong>Fiji</strong>/<br />
Development partners<br />
Ministry of iTaukei Affairs, National Trust of <strong>Fiji</strong>/<br />
Development partners<br />
Ministry of iTaukei Affairs, National Trust of <strong>Fiji</strong>/<br />
Development partners<br />
Ministry of iTaukei Affairs, National Trust of <strong>Fiji</strong>/<br />
Development partners<br />
Ministry of iTaukei Affairs, National Trust of <strong>Fiji</strong>/<br />
Development partners<br />
Reconstruction Needs 8.5<br />
Repair and reconstruction of traditional houses in Navala Village<br />
Immediate rehabilitation and restoration of built heritage (residential<br />
houses) in Levuka<br />
Restoration of built heritage on Makogai and establishment of<br />
protection buffer<br />
Ministry of iTaukei Affairs, National Trust of <strong>Fiji</strong>/<br />
Development partners<br />
Ministry of iTaukei Affairs, National Trust of <strong>Fiji</strong>/<br />
Development partners<br />
Ministry of iTaukei Affairs, National Trust of <strong>Fiji</strong>/<br />
Development partners<br />
FIJI Post-Disaster Needs Assessment<br />
Activity<br />
Rehabilitation and restoration of other built heritage in Levuka<br />
(Levuka Heritage Infrastructure)<br />
Construction of Navala ethnological museum and adjoining<br />
exhibition office facilities for tourism purposes<br />
Construction and installation of basic amenities in Navala, including<br />
electricity, water supply, fire hydrant system sewerage<br />
Regeneration of essential traditional architectural raw materials<br />
(environmental)<br />
Full restoration of damaged repositories of heritage<br />
Development of safeguarding plans for intangible cultural heritage<br />
with bearers and communities<br />
Development of social education tools to enhance sustainable<br />
culture and heritage<br />
Establishment of incubation spaces, galleries and advisory portals<br />
for cultural goods producers<br />
Source: Estimations by Assessment Team.<br />
Responsible Agency<br />
Ministry of iTaukei Affairs, National Trust of <strong>Fiji</strong>/<br />
Development partners<br />
Ministry of iTaukei Affairs, National Trust of <strong>Fiji</strong>/<br />
Development partners<br />
Ministry of iTaukei Affairs, National Trust of <strong>Fiji</strong>/<br />
Development partners<br />
Ministry of iTaukei Affairs, National Trust of <strong>Fiji</strong>/<br />
Development partners<br />
Ministry of iTaukei Affairs, National Trust of <strong>Fiji</strong>/<br />
Development partners<br />
Ministry of iTaukei Affairs, National Trust of <strong>Fiji</strong>/<br />
Development partners<br />
Ministry of iTaukei Affairs, National Trust of <strong>Fiji</strong>/<br />
Development partners<br />
Ministry of iTaukei Affairs, National Trust of <strong>Fiji</strong>/<br />
Development partners<br />
Cost<br />
(F$ million)<br />
4.2<br />
0.2<br />
0.5<br />
0.1<br />
0.3<br />
0.1<br />
0.0<br />
0.2<br />
Table 98: Reconstruction and Resilience Needs for Disaster Risk Management<br />
Activity<br />
Responsible Agency<br />
Cost<br />
(F$ million)<br />
Total Recovery and Reconstruction Needs 14.7<br />
Reconstruction Needs 2.7<br />
Reconstruction, replacement and repair of priority assets and<br />
buildings<br />
NDMO/Development partners/Donors 2.7<br />
Resilience Needs 12.0<br />
Strengthen governance and institutional arrangements NDMO/Development partners/ 0.9<br />
Understand risk NDMO 2.1<br />
Strengthen community resilience NDMO/Development partners 4.7<br />
Develop a comprehensive DRM communications strategy NDMO/Development partners 0.2<br />
Develop a monitoring and evaluation framework and systems to track<br />
the development and implementation of DRM across government<br />
agencies and publish a biennial state of DRM report<br />
NDMO/Development partners 0.1<br />
Invest in catastrophe risk insurance, including regional schemes GoF 4.0<br />
Source: Estimations by Assessment Team.<br />
Table 99: Recovery and Reconstruction Needs for Employment, Livelihoods and Social Impact<br />
Activity<br />
Responsible Agency<br />
Cost<br />
(F$ million)<br />
Total Recovery and Reconstruction Needs 34.0<br />
Recovery Needs 5.0<br />
Micro-enterprise support and preparedness<br />
Enterprise Recovery Programme (to support enterprises in the<br />
formal sector)<br />
Expansion of existing social benefit scheme<br />
Integrated Human Resource Development<br />
Programme (lead), Ministry of Employment,<br />
Ministry of Social Welfare, Ministry of Youth/<br />
National Youth Council of <strong>Fiji</strong> Islands, <strong>Fiji</strong><br />
Disabled Peoples Federation, Women<br />
Entrepreneurs & Business Council (WEBC),<br />
Young Entrepreneurs Council (YEC)/ILO/UNDP<br />
Ministry of Industry & Trade (lead)/ <strong>Fiji</strong><br />
Commerce & Employers Federation (FCEF)/<br />
ILO/UNDP<br />
Ministry of Women, Children & Social Welfare<br />
(lead)/<strong>Fiji</strong> Council of Social Services<br />
7<br />
10<br />
7<br />
Tropical Cyclone Winston, February 20, 2016<br />
139
FIJI Post-Disaster Needs Assessment<br />
Activity<br />
Capacity Building of Government agencies and CSOs that support<br />
micro enterprises<br />
Skills Development & Business Confidence Programme for<br />
Construction Sector using Employment Intensive Infrastructure<br />
Programmes (EIIP)<br />
Child labour monitoring, advocacy and withdrawal programme<br />
Study on the <strong>Fiji</strong> National Provident Fund (FNPF) on the impact of<br />
withdrawals for disasters and social security support programmes<br />
for informal workers<br />
Responsible Agency<br />
Cost<br />
(F$ million)<br />
ILO/UNDP 3.5<br />
Ministry of Employment/National Employment<br />
Center (lead), Ministry of Youth, Ministry<br />
of Women, Children and Social Services/<br />
National Youth Council of <strong>Fiji</strong> Islands, <strong>Fiji</strong><br />
Disabled Peoples Federation/ILO/UNDP<br />
Ministry of Women, Children & Social Welfare/<br />
<strong>Fiji</strong> Council of Social Services<br />
Ministry of Employment/National Employment<br />
Center with support from Development<br />
partners<br />
3<br />
0.5<br />
0.5<br />
Source: Estimations by Assessment Team.<br />
140 Tropical Cyclone Winston, February 20, 2016
FIJI Post-Disaster Needs Assessment<br />
Annex 3: Supplementary Material for<br />
Employment, Livelihoods and Social<br />
Protection<br />
Table 100: Population Affected by TC Winston<br />
Division Deaths Missing Hospitalised Injured<br />
Number<br />
of people<br />
affected due<br />
to loss of<br />
livelihood of<br />
main bread<br />
winner<br />
Number<br />
of people<br />
displaced<br />
Total number<br />
of those<br />
affected<br />
Central 6 2 24 162,698 5245 167,975<br />
Eastern 22 1 3 59 30,222 7595 37,902<br />
Northern 3 5 10 93,488 10210 103,716<br />
Western 13 17 24 198,622 32145 230,821<br />
Total 44 1 27 117 485,030 55,195 540,414<br />
Source: Estimations by Assessment Team.<br />
Table 101: Poverty Alleviation Government Programmes by Year (F$ million)<br />
Programmes 2009 2010 2011 2012 2013 2014 2015 2016<br />
Department of Social Welfare<br />
Poverty Alleviation Projects 1.0 0.6<br />
Poverty Benefit Scheme 22.6 22.0 22.0 22.0<br />
Child Protection Allowance 0.4 4.4 4.4 4.4 6.0 4.5 2.0 3.2<br />
Social Pension Scheme 3.2 3.0 8.0 13.0<br />
Food Voucher Programme 7.4 11.0 12.6 1.3 1.0 0.5<br />
Women's Plan of Action 0.4 0.3 0.3 0.6 0.6 0.8 1.0 1.0<br />
Cottage Industry Development 0.3 0.1<br />
Integrated National Poverty Eradication Programme 0.3 0.3 0.3 0.3 0.3<br />
Welfare Graduation Programme 0.6 0.6 0.5 0.5 0.5 0.5<br />
<strong>Fiji</strong> National Council of Disabled Persons 0.3 0.3 0.3 0.4<br />
Capital Grant to Voluntary Organizations 0.4 0.4 0.2 0.2 0.1 0.2 0.2 0.3<br />
Family Assistance Scheme 20.0 15.0 15.0 15.0<br />
Women’s Resources Centre 0.2<br />
Grants to Girls' Home 0.1 0.1 0.1 0.2<br />
Fire Victims Relief 0.1 0.1 0.1 0.2<br />
Education<br />
Education/ Poverty Relief Fund 0.2 0.3<br />
Bus Fare Subsidy 12.0 12.0 11.0 20.8 20.0 19.0<br />
Health<br />
Free Medicine 8.0 10.0<br />
Department of Housing<br />
HAG (2011)/Housing Assistance for First Time<br />
Home Buyers<br />
10.0 10.0 10.0 10.0 10.0<br />
Low Cost Housing Project (HA) 12.0<br />
Public Rental Housing Project 10.0<br />
Lagilagi Housing Development Project - Phase 2 3.0 2.0 3.3<br />
Savusavu Development Project 2.5 3.4 2.6<br />
Tropical Cyclone Winston, February 20, 2016<br />
141
FIJI Post-Disaster Needs Assessment<br />
Programmes 2009 2010 2011 2012 2013 2014 2015 2016<br />
Squatter Upgrading and Resettlement Programme 2.0 1.5 1.5 2.0 1.0 2.0 3.0 4.0<br />
Kalabu Development Project 1.5 0.7<br />
HART 1.0 1.0 1.0 0.6 0.6 1.0 0.5 0.5<br />
HA Social Housing Policy 1.0 1.0 0.5 0.5<br />
Informal Settlement Project 1.0 3.0 1.0<br />
Sustainable Income Generating Project 0.5 0.4 0.7 0.5 0.3<br />
City Wide Squatter Upgrading Project 0.5 0.5 0.4<br />
National Housing Policy Implementation Plan 0.2 0.2 0.2 0.2 0.2<br />
HA Matavolivoli Development Project 4.9<br />
Housing Assistance to Fire Victims 1.0 1.0<br />
Prime Minister’s Office<br />
Funds for the Education of Needy Children 0.2 0.2<br />
Strategic Planning<br />
Northern Development Programme 3.0 1.0 1.0 1.0 1.0 1.5 1.5 1.5<br />
Miscellaneous<br />
Tertiary Education Loan Scheme 52.5 42.5 42.5<br />
Student Loan Scheme 1.0 1.0 1.0 1.0 1.0<br />
National Toppers Scholarship Scheme 10.0 10.0<br />
Existing Scholarship Scheme 26.0 15.7 8.0<br />
FDB Subsidy 5.6 4.0 2.5 4.0 3.9 5.0 5.5 4.8<br />
FDB - Interest Subsidy (Northern Division Projects) 0.6 0.6 0.5 0.6 0.2 0.2<br />
FEA Subsidy 3.5 3.5 3.5 3.5 5.7 5.7<br />
Commerce<br />
Micro Finance 0.5<br />
Multi Ethnic Affairs<br />
Multi Ethnic Affairs Scholarships 5.5 5.5 5.5 5.5 5.5<br />
Ministry of Labour<br />
National Employment Centre 1.1 0.8 0.8<br />
TOTAL 41.8 43.0 70.0 75.6 63.8 189.0 169.9 172.0<br />
Source: Estimations by Assessment Team.<br />
142 Tropical Cyclone Winston, February 20, 2016
FIJI Post-Disaster Needs Assessment<br />
Annex 4: Supplementary Material for the<br />
Commerce and Manufacturing Sectors<br />
Financial Sector Damage, Losses and Recovery Needs<br />
The direct impact of TC Winston on the financial sector was very low, with limited damage to buildings from wind or<br />
flooding, which is a testament to resilient design. Most financial services were fully operational by February 26, with only a<br />
few locations offering limited services and two banks closed, and a week later all were operational. The financial sector is<br />
fully insured for damage.<br />
All the banks are offering affected customers a relief package, which will come in the form of the postponement of loan<br />
repayments and restructuring to reduce debt stress and make funds available to those who need to rebuild or restock.<br />
While on the one hand the postponement of payments will affect income in the short term, the new lending to fund<br />
rebuilding will supplement income. The degree of default on loans particularly for those customers whose business were<br />
damaged, remain closed and have no insurance will remain unknown for some time. The financial sector has donated<br />
upwards of F$700,000 to the humanitarian effort. The Provident Fund announced that all members could draw F$1,000<br />
from its superannuation account and up to F$5,000 for members who had to rebuild houses.<br />
Insurance companies have reported total claims of F$255 million offset by F$49.9 million in recoveries (excess) resulting in<br />
a net F$155 million impact on the industry. The majority of claims have yet to be assessed and, invariably, the total value<br />
of claims paid will be lower. Additionally, some claims will not be considered valid as they may fall outside the terms of the<br />
relevant insurance policy and will therefore be rejected. Total claims processed are expected to be around 85 percent of<br />
the current value. The process of validating claims and making payments will typically take 12 to 14 months, and longer<br />
still when litigation is required.<br />
Recovery Needs<br />
The financial sector can disburse and manage funding to help rebuild the industry. Where not viable for the banks themselves<br />
to lend, they lend donor/soft loans through their system and networks, for example agri loans to sugar farmers or housing<br />
finance to small value home owners. To facilitate this, banks will need access to soft/subsidized loans and a fee to cover<br />
operation costs.<br />
Tropical Cyclone Winston, February 20, 2016<br />
143
FIJI Post-Disaster Needs Assessment<br />
Annex 5: Supplementary Material for the<br />
Housing Sector<br />
Methodology Used for Determining TC Winston Housing<br />
Sector Damage and Losses<br />
The process for estimating the effects of TC Winston on the residential housing stock has two steps: one, estimation of<br />
the baseline housing stock and its economic value; and, two, estimation of the effects on the housing stock following TC<br />
Winston. The analysis for the housing sector was carried out at the Tikina level (equivalent to the provincial level), later<br />
aggregated up to the divisional level.<br />
Estimated Breakdown of the Baseline Building Stock by<br />
Building Type<br />
The baseline building stock was estimated through use of 2007 Census data, which shows the breakdown of the number<br />
of households living in six different building typologies. This information was overlaid on the exposure data available from<br />
the PCRAFI data compiled in 2010 for estimating the total number of buildings. Population growth rates were derived for<br />
each Tikina using population census growth rates between 1996 and 2007. This growth rate was applied to the 2007<br />
census household data to estimate the 2010 average household numbers per building type per Tikina, from which the<br />
number of housing units per building type per Tikina were derived. This established the housing stock baseline for 2010,<br />
which was then projected to 2014 using the population growth rate between 1996–2007 per Tikina. Table 102 shows the<br />
pre-event housing building stock as estimated using the method described above.<br />
Table 102: Estimated Pre-Event Building Stock by Province<br />
Province Concrete Wood Tiniron Bure Makeshift Other Total<br />
Ba 21,796 7,503 17109 675 282 168 47,533<br />
Bua 158 841 1611 127 28 30 2,795<br />
Cakaudrove 1,128 4,182 2,105 278 109 56 7,858<br />
Kadavu 621 845 644 44 5 2 2,161<br />
Lau 1,051 2,920 1,823 68 16 18 5,896<br />
Lomaiviti 861 802 774 43 19 19 2,518<br />
Macuata 1,278 2,099 1,967 134 55 101 5,634<br />
Nadroga 4,034 1,163 3,532 349 90 83 9,251<br />
Naitasiri 11,681 4,900 8,141 277 119 122 25,240<br />
Namosi 256 311 678 103 46 25 1,419<br />
Ra 1,441 934 3,019 385 90 77 5,946<br />
Rewa 9,609 3,125 3,555 69 58 10 16,426<br />
Rotuma 368 124 92 52 3 1 640<br />
Serua 864 783 904 35 8 3 2,597<br />
Tailevu 2,682 2,983 4,398 188 58 69 10,378<br />
Total 57,828 33,515 50,352 2,828 986 784 146,292<br />
Source: Estimations by Assessment Team.<br />
Estimated Damage to the Housing Stock by Building Type<br />
Data on damage to the housing stock collected in the field and compiled by the NDMO was made available for the PDNA<br />
and was the main source of information for damage estimation. Information on damage is available for the four divisions<br />
in <strong>Fiji</strong>. The data from NDMO reports damage to residential buildings using two classes: destroyed and damaged. The<br />
challenge was to disaggregate this information by building type to be able to estimate the economic impact on the housing<br />
sector, and to further separate the buildings reported as damaged into major damage and minor damage. Considering<br />
144 Tropical Cyclone Winston, February 20, 2016
FIJI Post-Disaster Needs Assessment<br />
the damage observed in the field characteristically caused by strong winds, major damage was defined as major damage<br />
to the roof (blown off), whereas minor damage was defined as partial damage to the roof and/or some claddings or other<br />
non-structural building elements. For the disaggregation of these reported buildings into building types, information on the<br />
vulnerability of typical building types in the Pacific was used. Vulnerability was assessed at various intensity levels—in this<br />
case wind speed of the cyclone—using information available from the scientific literature.<br />
To further disaggregate into major damage and minor damage, all buildings in the damaged category reported by NDMO<br />
were simply split 50:50, using expert judgement and reflecting the field reports, which described the observed proportion<br />
of the damaged buildings in the field to be 60:40 in the high-intensity (=high wind speed) areas. The assumption was that<br />
the further away from the center of the hurricane track, the lower the damage. Using this logic, in low intensity areas the<br />
nominal split between major and minor damage was assumed to be 40:60, meaning that the average of the split across<br />
the country would be 50:50. With the information available, coming up with a more realistic ratio between the two damage<br />
levels was not possible, unless an extensive field survey was carried out. After splitting the number of NDMO reported<br />
damaged category buildings into 50:50 for major and minor damage, the breakdown of the number of buildings in each<br />
damage class by building type was estimated again using the information about the vulnerabilities of the building types in<br />
the literature.<br />
The entire country was divided into three intensity areas (based on wind speed), using 80-160 kph (intensity 1), 160-240<br />
kph (intensity 2) and 240-320 kph (intensity 3). Cyclone wind speed maps were used to allocate an intensity level to each<br />
province, assuming a homogeneous wind speed within a province. Figure 37 shows the provinces colored according to<br />
the intensity level assigned for this exercise.<br />
Figure 37: Provinces Color Coded According to Wind Speed Intensity Levels<br />
Source: Estimations by Assessment Team.<br />
The final estimated breakdown of the number of housing units 136 by building type, damage class and Tikina. Table 103<br />
shows results aggregated at the province level.<br />
136<br />
An assumption was made that, in <strong>Fiji</strong>, most housing units are single dwellings.<br />
Tropical Cyclone Winston, February 20, 2016<br />
145
FIJI Post-Disaster Needs Assessment<br />
Table 103: Breakdown of Affected Residential Buildings into Damage Levels by Province<br />
Province Destroyed Major Damage Minor Damage<br />
Destroyed and Major<br />
Damage as % of all<br />
Units<br />
Ba 3,494 4,241 4,241 16%<br />
Bua 524 605 605 40%<br />
Cakaudrove 1,513 2,199 2,199 47%<br />
Kadavu 0 0 0 0%<br />
Lau 328 63 63 7%<br />
Lomaiviti 1,191 296 296 59%<br />
Macuata 5 10 10 0%<br />
Nadroga 113 259 259 4%<br />
Naitasiri 542 365 365 4%<br />
Namosi 27 14 14 3%<br />
Ra 2,813 757 757 60%<br />
Rewa 66 77.5 77.5 1%<br />
Rotuma 0 0 0 0%<br />
Serua 19 19 19 1%<br />
Tailevu 395 287 287 7%<br />
Total 11,030 9,130 9,130<br />
Source: Estimations by Assessment Team.<br />
To calculate the economic impact of TC Winston on the housing sector, information on average floor size and unit cost was<br />
gathered through extensive consultation with local construction experts. Furthermore, the PCRAFI data provided a national<br />
view of the ratio of urban (46 percent) and rural (54 percent) buildings in the country. The assumptions used in the analysis<br />
are shown in Table 104.<br />
Table 104: Assumptions Used to Determine Damage and Losses to the Housing Sector (Average Floor Size and Unit Cost<br />
for Various Building Materials)<br />
Concrete Wood Tin or iron<br />
Bure<br />
materials<br />
Makeshift<br />
material<br />
Average Floor size (m 2 ) 80 60 60 35 75 24<br />
Urban Unit Cost F$/m 2 750 650 650 300 200 250<br />
Rural Unit Cost F$/m 2 650 650 650 300 200 250<br />
Source: Estimations by Assessment Team.<br />
Using this information, damage to the housing stock was estimated to be F$667 million. The breakdown of the number of<br />
affected residential buildings by division is shown in Table 105.<br />
Table 105: Estimated Damage to Residential Buildings by Division (F$ million)<br />
Division<br />
Total Value of Pre-<br />
Disaster Housing Stock<br />
Cost of Damage to Housing Stock<br />
Other<br />
Destroyed Major Damage Minor Damage<br />
Central 3,122.8 46.5 12.0 6.3<br />
Eastern 558.7 75.0 6.2 2.7<br />
Northern 692.9 96.1 44.7 22.3<br />
Western 3,430.7 304.4 90.1 45.4<br />
Source: Estimations by Assessment Team.<br />
146 Tropical Cyclone Winston, February 20, 2016
FIJI Post-Disaster Needs Assessment<br />
Annex 6: Disaster Risk Management<br />
6.1 The Role of Government in DRM in <strong>Fiji</strong><br />
The National Disaster Management Council (NDMC) is the forum that formulates disaster management policies. The<br />
responsibility for national disaster management rests with the National Disaster Controller, who assumes powers on the<br />
formal declaration of a natural disaster under the National Disaster Management Act 1998.<br />
The National Disaster Management Office (NDMO) implements NDMC policies and establishes the National Emergency<br />
Operations Centre (NEOC) during emergencies. The NDMO/NEOC is assisted by Disaster Service Liaison Officers from<br />
government agencies as the main points of contact for liaison and coordination. At the division and district levels, the<br />
Commissioner and District Officer, respectively, are responsible for the emergency operation, in close coordination with the<br />
National Disaster Controller and NDMO/NEOC.<br />
Divisional Commissioners have overall authority to manage and direct disaster emergency operations within their<br />
respective divisions and are subordinate to the National Disaster Controller and NDMC-Emergency Committee. However,<br />
the Commissioner has the autonomy to activate Divisional Emergency Operations upon issuance of a warning of an<br />
approaching disaster, with powers to control all agency resources within the Division. The Commissioner is also responsible<br />
for developing a comprehensive disaster management plan for the division and, in close cooperation with NDMO,<br />
contributes to the implementation of disaster management policies.<br />
At the district level, the District Officer is responsible for preparing a District Disaster Management Plan and ensures that<br />
various agencies and NGOs in the district prepare detailed disaster operation plans which the District Officer must vet and<br />
adopt as part of the District Plan.<br />
6.2 Detailed Recommendations for Financial Resilience<br />
Once the government has an understanding of its contingent liabilities, it can consider developing a DRFI strategy with<br />
a combination of tools to meet different levels of post-disaster funding needs. The DRFI note prepared in 2014 (PCRAFI,<br />
2014) outlines existing financial instruments available to <strong>Fiji</strong> and details options for consideration. Revisiting this note and<br />
its recommendations in the aftermath of TC Winston is suggested.<br />
Importantly, no single tool will remove all of the financial burden from disasters. Rather, the government should look to ‘layer’<br />
its financial tools to best meet the disaster needs at different levels of severity. For example, <strong>Fiji</strong> has the Prime Minister’s<br />
Fund to manage those events that occur frequently and cause a low level of damage, but these domestic reserves will<br />
be quickly exhausted when more severe disasters occur. Therefore, this funding source should be complemented by<br />
additional tools.<br />
To help avoid costly budget reallocation when these events occur, the government should consider establishing a line<br />
of contingent credit for mid-sized disasters. The advantage of this is that since it is arranged in advance, funds can be<br />
disbursed within 24 hours of an event, as was the case in the Philippines following TC Haiyan.<br />
For the most extreme events, such as TC Winston, the Government of <strong>Fiji</strong> should consider risk transfer. Under the PCRAFI<br />
insurance programme, countries pay a premium to transfer some of their risk to international reinsurance markets. Following<br />
an eligible event and based on their policy choices, countries will receive a payout within 10 days as an injection of cash<br />
to provide direct budget support. Both Tonga (TC Ian, January 2013) and Vanuatu (TC Pam, March 2015) have received<br />
payouts under this scheme. However, risk transfer is only cost effective for less frequent, more severe events.<br />
Another key decision that the government must make is to stipulate what it will cover in the aftermath of a disaster and<br />
what can be managed by the private sector. By crowding in the private sector insurance markets, the government may be<br />
able to transfer some risk to the domestic insurance industry. For example, building capacity within the domestic insurance<br />
market and ensuring the industry is properly regulated, the cost of reconstruction to private households can be transferred<br />
to the domestic insurance industry. Using insurance in this way also reinforces the need to adhere to the building code as<br />
the assets must be of an insurable quality. In the same vein, the government can also insure its key public buildings, which<br />
would complement the PCRAFI insurance (which acts as budget support) by providing finance for the reconstruction of<br />
these buildings and helping to reduce their contingent liability.<br />
A review of the domestic insurance industry was contained in the DRFI note produced for <strong>Fiji</strong>, which states that the <strong>Fiji</strong><br />
non-life (general) insurance market is the second-largest in the Pacific island countries, with a total premium of F$174.5<br />
Tropical Cyclone Winston, February 20, 2016<br />
147
FIJI Post-Disaster Needs Assessment<br />
million (US$$93 million). Seven local insurers are currently operating with a total premium income of F$145.5 million. The<br />
balance of F$29 million (US$16 million) is equal to 17 percent of the market and is placed with offshore insurers by the four<br />
local brokers (PCRAFI, 2014). This suggests that there is scope to build the capacity of the domestic insurance industry to<br />
provide catastrophe risk extensions to help alleviate the contingent liabilities faced by the Government of <strong>Fiji</strong>.<br />
Kings Road, Navutulevu Village, Rakiraki, Ra Province, Viti Levu<br />
Source: Vlad Sokhin/World Bank<br />
148
FIJI Post-Disaster Needs Assessment<br />
Annex 7: List of Contributors<br />
Macro-economic Impact Assessment<br />
Paula Cirikiyasawa (SPO), David Smith (UNESCAP), Mizuho Kida (WB), Virginia Horscroft (WB), Shiu Singh (ADB)<br />
Employment, Poverty and Social Protection<br />
Jone Biaukula (SPO), Vilimone Baledrokadroka (MOE), Lusiana Naimawi (SPO), Vitalina Chung (SPO), Asha Kambon<br />
(ILO), Edward Bernard (ILO), Aisha Mansur (WB), Julian Schweitzer (ILO), William Naisara (Ministry of Youth and Sports),<br />
Rupeni Fatiaki (Ministry of Women, Children and Poverty Alleviation), Asif Chida (UNDP), Thomas Jensen (UNDP), Dilitiana<br />
Baleinabuli (Ministry of Women, Children and Poverty Alleviation), Nesbitt Hazelman (FCEF), Christine Pickering (WEBC),<br />
Avinit R. Narayan (YEC), Stanley Raniga (Roaster Chicken), Felix Anthony (FTUC), William Nayacatabu (National Youth<br />
Council of the <strong>Fiji</strong> Islands), Niel Maharaj (FCOSS), Lanieta Tuimabu (FDPF), Agni Deo Singh (<strong>Fiji</strong> Teachers Union), Rishi Ram<br />
(<strong>Fiji</strong> Taxi Union), Sundresh Chetty (Sugar Cane Growers Council)<br />
Agriculture, Fisheries and Forestry<br />
Ilimeleki Kaiyanuyanu (MOA), Sunia Baikeirewa (SPO), Dominique Blariaux (FAO), Kofi Nouve (WB), Henri Loze (WB), Anare<br />
Motokula (SPC), Gibson Susumu (SPC), Mere Lakeba (Ministry of Fisheries and Forest), Martin Nabola (SPO), Ian Bertram<br />
(SPC), Etuati Ropeti (SPC), Michel Blanc (SPC), Semi Dranibaka (Ministry of Fisheries and Forest), Epeli Waqavonovono<br />
(SPO), Jalesi Mateboto (SPC), Loraini Baleilomaloma (SPC), Maria Elder-Ratutokarua (SPC), Paitia Nagalevu (SPC), Tim<br />
Pickering (SPC), Shalendra Singh (SPC)<br />
Commerce and Manufacturing<br />
Ramesh Chand (MITT), Kavita Ram (SPO), John Vivian (IFC), Sanjesh Naidu (UNESCAP), Wilisoni Jiuta (MITT)<br />
Tourism<br />
John Edwin Rosa (Department of Tourism), Vineil Narayan (SPO), David Smith (UNESCAP), Dina Nicholas (IFC), John Vivian<br />
(IFC), Rebecca Jane Last (IFC)<br />
Mining and Quarry Industry<br />
Sakaraia Malodali (Department of Mineral Resources), Lorosio Raikivi (Department of Lands), Taributi Bebeia (SPO), John<br />
Vivian (IFC)<br />
Education<br />
Manoa Semicarawa (MOE), Osea Ragolea (SPO), Gail Owen (DFAT), Rhys Gwilliam (DFAT), Apimeleki Qionitoga (MOE),<br />
Emosi Davetanivalu (SPO)<br />
Health<br />
Idrish Khan (MoHMS), Sanaila Laqai (SPO), Mark Jackson (WHO), Jason Lee (DFAT), Sandra Paredez (UNFPA), Geetashni<br />
Chand (SPO), Mark Jackson (WHO), Vimal Deo (MoHMS)<br />
Housing<br />
Vula Shaw (MLGHE), Turaga Basalusalu (SPO), Colleen Butcher-Gollach (WB), Danny Southcombe (UN-Habitat),<br />
Joji Waqamailau (Ministry of Rural and Maritime Development), Mitieli K. Ratinaisiwa (Ministry of Rural and Maritime<br />
Development), Simi Sorowale (Ministry of Rural and Maritime Development)<br />
Transport<br />
Apikali Beta Raicebe (FRA), Aram Goes (FRA), Faranisese Kinivuwai (SPO), Luke Koroisave (SPO), Vula Seru (AFL), David<br />
Ling (ADB), Richard Phelps (ADB), Christopher Wensley (ADB)<br />
Water and Sanitation<br />
Peni Babale (WAF), Luke Koroisave (SPO), Iliesa Masi (WAF), Stephen Blaik (ADB), Jude Kohlhase (ADB), Tomoko Minova<br />
(UNISDR)<br />
Electricity<br />
Anthony Maxwell (ADB), Krishneel Prasad (FEA), Mike Trainor (ADB), Mikaele Belena (DoE), Sandip Kumar (MoF/SPO),<br />
Karunesh Rao (FEA)<br />
Tropical Cyclone Winston, February 20, 2016<br />
149
FIJI Post-Disaster Needs Assessment<br />
Communication<br />
Jonacani Nalave Veiqati (Ministry of Communications), Tui Sikivou (SPO), Christopher Wensley (ADB), Ewan Perrin<br />
(Communications and Information Technology), Shivnesh Prasad (Ministry of Communications), Elvin Prasad (Ministry of<br />
Communications), Tevita Navila (Telecommunications Authority of <strong>Fiji</strong>)<br />
Environment<br />
Sarah Tawaka (MGHE), Ilaitia Finau (SPO), Mesake Semainaliwa (SPO), Habiba Gitay (WB), Katarina Atalifo (UNDP), Herman<br />
Timmermans (SPREP), Jan Steffen (MACBIO project), Hans Wendt (MACBIO project), Sangeeta Mangubhai (WCS), Kate<br />
Davey (IUCN), Susana Tuisese (CI), Marika Tuiwawa (USP), Brad Carte (FLMMA), Alisi Rabukawaqa (Coral Reef Alliance)<br />
Gender<br />
Raijieli Mawa (MWCPA), Vitalina Chung (SPO), Cecilia Aipira (UN Women), Allanah Kidd (UN Women), April Pham (UN<br />
Women), Amelia Nairoba (Department of Women)<br />
Culture and Heritage<br />
Maciusela Raitaukala (Department of Heritage and Arts), Osea Ragolea (SPO), Akatsuki Takahashi (UNESCO), Elise Huffer<br />
(SPC), Jean Rice (ICOMOS Australia), Kiho Yaoita (Hokkaido University), Kanefusa Masuda (ICOMOS Japan), Yoshihito<br />
Minowa (Erasito Consultants Ltd.), Sipiriano Nemani (Department of Heritage and Arts), Marilyn Korovusere (Ministry of<br />
iTaukei Affairs)<br />
Disaster Risk Management<br />
Akapusi Tuifagalele (NDMO), Jone Biaukula (SPO), Mosese Sikivou (SPC), Paul Taylor (SPC), Kirstie Meheux (SPC), Shohei<br />
Matsuura (SPC/JICA), Samantha Cook (WB), Timothy Wilcox (UNISDR), Noud Leenders (UNDP), Puji Pujiono (UNESCAP),<br />
Alice Mortlock (WB), Litiana Bainimarama (SPO), Litea Biukoto (SPC)<br />
Mapping Support<br />
Sole Tubanaika (FBOS), Poasa Naimila (FBOS), Litea Biukoto (SPC), Kifle Kahsai (SPC), Herve Damlamian (SPC), Wolf<br />
Forstreuter (SPC), Keiko Saito (WB)<br />
Sector Assessment Peer Reviewers<br />
Michael Blanc (SPC), Owen Shumba (UNDP), Rita Missal (UNDP), Sanny Jegillos (UNDP), Lisa Farroway (UNDP), Moortaza<br />
Jiwanji (UNDP), Doley Tshering (UNDP), Arron Buncle (SPREP), Charolett De Fontaubert (WB), Priscilla Phelps (WB), George<br />
Soraya (WB), James Reichert (WB), Shiu Singh (ADB), Hans Shrader (WB), Chris Bennett (WB), Abraham Brandenburg<br />
(Independent Consultant), Tukana Bovoro (Independent Consultant)<br />
Coordination<br />
Paula Cirikiyasawa (SPO), Kemueli Naiqama (SPO), Jone Biaukula (SPO), Sanaila Laqai (SPO), Michael Bonte-Grapentin<br />
(WB), Simone Esler (WB), Sirkka Killmann (WB), Roberto Jovel (WB), Joanne Chloe (DFAT), Noud Leenders (UNDP), Andrew<br />
Parker (ADB), Christopher Wensely (ADB), Mosese Sikivou (SPC), Jesús Laviña (EU)<br />
150 Tropical Cyclone Winston, February 20, 2016
FIJI Post-Disaster Needs Assessment<br />
Annex 8: References and Materials<br />
Consulted<br />
ADB 2015: <strong>Fiji</strong> Country Gender Assessment.<br />
ADB/ILO. 2015. <strong>Fiji</strong>: Creating Quality Jobs: Employment Diagnostic Study.<br />
Country Risk Profile: <strong>Fiji</strong>. 2011. PCRAFI (Pacific Catastrophe Risk Assessment and Financing Initiative). September 2011.<br />
Disaster Risk Finance and Insurance Note: <strong>Fiji</strong>. 2014. PCRAFI (Pacific Catastrophe Risk Assessment and Financing Initiative).<br />
Economic Valuation of Marine Protected Areas: Vanuatu and <strong>Fiji</strong> Case Studies, IUCN. Pascal, N. (2013).<br />
Economic Valuation of Tourism and Fisheries in the Vatu-i-Ra Seascape, Republic of <strong>Fiji</strong>. Brian Kastl Stuart Gow. Wildlife Conservation<br />
Society.<br />
<strong>Fiji</strong> Biodiversity Strategy and Action Plan, 2007.<br />
<strong>Fiji</strong> Bureau of Statistics. 2011: Republic of <strong>Fiji</strong> Poverty Trends, Profiles and Small Area Estimation (poverty maps) in Republic of <strong>Fiji</strong> (2003-<br />
2009).<br />
<strong>Fiji</strong> Employment and Unemployment Survey 2010–2011: Preliminary Findings. 2012. <strong>Fiji</strong> Bureau of Statistics.<br />
<strong>Fiji</strong> National Agricultural Census 2009. Department of Agriculture, Economic Planning and Statistics Division Report.<br />
<strong>Fiji</strong> National Council for Disabled Persons. 2010. National Disability baseline study. “Making Women with Disabilities Visible.”<br />
<strong>Fiji</strong>: Severe Tropical Cyclone Winston Situation Report No. 11 (as of 3 March 2016) (PDF) (Situation Report). ReliefWeb. United Nations<br />
Office for the Coordination of Humanitarian Affairs. Retrieved 3 March 2016.<br />
<strong>Fiji</strong>’s State of the Environment Report, 2013.<br />
<strong>Fiji</strong> Women and Men at Work and Leisure: Final Report,” 2013. <strong>Fiji</strong> Bureau of Statistics<br />
<strong>Fiji</strong> Women Crisis Centre. 2013: Women’s Health and Domestic Violence Against Women Study.<br />
“Gender-Based Violence in the Aftermath of the <strong>Fiji</strong> Tropical Cyclone Winston.” April 9, 2016.Gender Based Violence Sub-Cluster Advocacy<br />
Note.<br />
GFDRR (Global Facility for Disaster Reduction and Recovery). 2013. “Post Disaster Needs Assessment Guidelines, Volume A.”<br />
Government of <strong>Fiji</strong>. 2013. PDNA Tropical Cyclone Evan. December 17, 2012.<br />
Green Growth Framework for <strong>Fiji</strong>. 2014. Ministry of Strategic Planning, National Development and Statistics.<br />
Hotel Licensing Board Database.<br />
Household Income and Expenditure Survey (HIES). 2002/2003. <strong>Fiji</strong> Bureau of Statistics.<br />
Household Income and Expenditure Survey (HIES). 2008/2009. <strong>Fiji</strong> Bureau of Statistics.<br />
Household Income and Expenditure Survey (HIES). 2013/2014. <strong>Fiji</strong> Bureau of Statistics.<br />
Informal settlement survey. People’s Community Network, November 2015.<br />
International Labour Organization. 2015. Rapid Assessment on Child Labour in <strong>Fiji</strong>.<br />
Interviews conducted by the Department of Social Protection, ILO, UN Women and UNDP on 13 April 2016.<br />
Interviews with women handcraft sellers in Lautoka.<br />
Jovel, Roberto, Estimation of Disaster-Induced Losses to Define Post-Disaster Recovery Requirements, in Disaster Recovery: The<br />
Governance, Economics, and Social Impacts, Asian Disaster Management News, Volume 22, Asian Disaster Preparedness Center<br />
(ADPC), Bangkok, Thailand, 2015.<br />
Korovulavula, I., O’Gara, T., Fong, P., Ratuniata, R. 2008. Economic Valuation: Iqoliqoli-tourism Study Support for <strong>Fiji</strong>, The University of<br />
the South Pacific.<br />
MACBIO project: The Marine and Coastal Biodiversity Management in Pacific Island Countries project. GIZ/IUCN.<br />
Manufacturing Sector Survey 2012. <strong>Fiji</strong> Bureau of Statistics.<br />
Myanmar Post-Disaster Needs Assessment of Floods and Landslides. July–September 2015, Government of the Union of Myanmar,<br />
November 2015.<br />
National Environment Council-IP Report<br />
Tropical Cyclone Winston, February 20, 2016<br />
151
FIJI Post-Disaster Needs Assessment<br />
National Population Census, 2007. <strong>Fiji</strong> Bureau of Statistics.<br />
Olson et al., 2010<br />
Population and Labour Force Estimates, 2014. <strong>Fiji</strong> Bureau of Statistics.<br />
Post-Disaster Waste Management Rehabilitation: Tropical Cyclone Winston and Flooding: Proposal.<br />
Provisional Annual Paid Employment 2014, Release No. 94. 2015. <strong>Fiji</strong> Bureau of Statistics.<br />
Provisional Hotel and Tourist Accommodation Statistics - Quarterly Release, June, 2nd Quarter, FBOS.<br />
Preservation of Objects of Archaeological and Paleontological Interest Act [Cap 264].<br />
Rapid Assessment of Coral Reef Damage, Vatu-I-Ra Seascape. Mangubhai, Sangeeta (2016).<br />
Rapid Biodiversity Assessment of the Nakorotubu Range, Ra and Tailevu Province, <strong>Fiji</strong>. (Morrison Clare, Nawadra S., Tuwawa M).<br />
Rapid Biodiversity Assessment Socioeconomic study and archeological survey of the Rewa River Mangroves, Viti Levu, <strong>Fiji</strong>. 2013 (Tuwawa<br />
M, Pene. S, Senilolia Tuiwawa).<br />
Sendai Framework for Disaster Risk Reduction 2015-2030.<br />
Someone’s Life, Every Body’s Business. 2013. National Research on Women’s Health and Life Experiences in <strong>Fiji</strong> (2010/2011): A survey<br />
exploring the prevalence, incidence and attitudes to intimate partner violence in <strong>Fiji</strong>. <strong>Fiji</strong> Women’s Crisis Centre.<br />
Status of coral reefs in the <strong>Fiji</strong> Islands, 2007. Helen Sykes.<br />
Tourism Statistics Year End Release. <strong>Fiji</strong> Bureau of Statistics.<br />
UNDP 2015: Human Development Report 2015.<br />
World Bank 2011. Republic of <strong>Fiji</strong> Poverty Trends, Profiles and Small Area Estimation (Poverty Maps) in Republic of <strong>Fiji</strong> (2003-2009).<br />
152 Tropical Cyclone Winston, February 20, 2016
FIJI Post-Disaster Needs Assessment<br />
Annex 9: Map of <strong>Fiji</strong><br />
Tropical Cyclone Winston, February 20, 2016<br />
153
FIJI Post-Disaster Needs Assessment<br />
154 Tropical Cyclone Winston, February 20, 2016
Damage to Ovalau Resort<br />
Source: Ministry of Information
Southern Taveuni Island, near Kanacea<br />
Source: Vlad Sokhin/World Bank<br />
Government of <strong>Fiji</strong><br />
Strategic Planning Office<br />
Paula Cirikiyasawa<br />
pcirikiyasawa001@planning.gov.fj