Fiji
yqgk302EGjo
yqgk302EGjo
You also want an ePaper? Increase the reach of your titles
YUMPU automatically turns print PDFs into web optimized ePapers that Google loves.
FIJI Post-Disaster Needs Assessment<br />
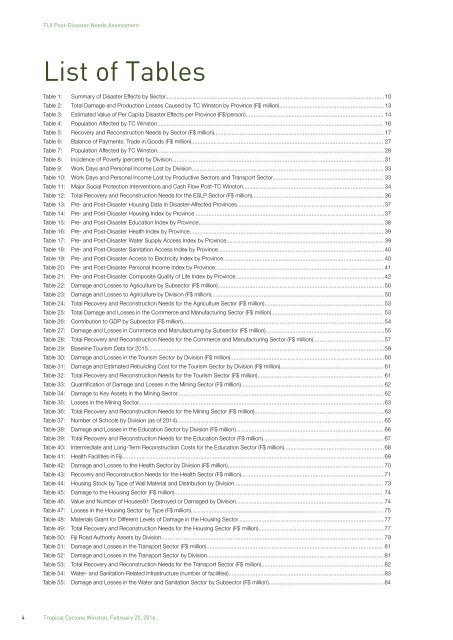
List of Tables<br />
Table 1: Summary of Disaster Effects by Sector.......................................................................................................................................... 10<br />
Table 2: Total Damage and Production Losses Caused by TC Winston by Province (F$ million).................................................................. 13<br />
Table 3: Estimated Value of Per Capita Disaster Effects per Province (F$/person)....................................................................................... 14<br />
Table 4: Population Affected by TC Winston.............................................................................................................................................. 16<br />
Table 5: Recovery and Reconstruction Needs by Sector (F$ million)........................................................................................................... 17<br />
Table 6: Balance of Payments: Trade in Goods (F$ million)......................................................................................................................... 27<br />
Table 7: Population Affected by TC Winston............................................................................................................................................... 28<br />
Table 8: Incidence of Poverty (percent) by Division...................................................................................................................................... 31<br />
Table 9: Work Days and Personal Income Lost by Division......................................................................................................................... 33<br />
Table 10: Work Days and Personal Income Lost by Productive Sectors and Transport Sector...................................................................... 33<br />
Table 11: Major Social Protection Interventions and Cash Flow Post-TC Winston......................................................................................... 34<br />
Table 12: Total Recovery and Reconstruction Needs for the ESLP Sector (F$ million)................................................................................... 36<br />
Table 13: Pre- and Post-Disaster Housing Data in Disaster-Affected Provinces............................................................................................. 37<br />
Table 14: Pre- and Post-Disaster Housing Index by Province........................................................................................................................ 37<br />
Table 15: Pre- and Post-Disaster Education Index by Province..................................................................................................................... 38<br />
Table 16: Pre- and Post-Disaster Health Index by Province.......................................................................................................................... 39<br />
Table 17: Pre- and Post-Disaster Water Supply Access Index by Province................................................................................................... 39<br />
Table 18: Pre- and Post-Disaster Sanitation Access Index by Province......................................................................................................... 40<br />
Table 19: Pre- and Post-Disaster Access to Electricity Index by Province..................................................................................................... 40<br />
Table 20: Pre- and Post-Disaster Personal Income Index by Province.......................................................................................................... 41<br />
Table 21: Pre- and Post-Disaster Composite Quality of Life Index by Province.............................................................................................. 42<br />
Table 22: Damage and Losses to Agriculture by Subsector (F$ million)......................................................................................................... 50<br />
Table 23: Damage and Losses to Agriculture by Division (F$ million)............................................................................................................. 50<br />
Table 24: Total Recovery and Reconstruction Needs for the Agriculture Sector (F$ million)........................................................................... 53<br />
Table 25: Total Damage and Losses in the Commerce and Manufacturing Sector (F$ million)...................................................................... 53<br />
Table 26: Contribution to GDP by Subsector (F$ million)............................................................................................................................... 54<br />
Table 27: Damage and Losses in Commerce and Manufacturing by Subsector (F$ million)........................................................................... 55<br />
Table 28: Total Recovery and Reconstruction Needs for the Commerce and Manufacturing Sector (F$ million)............................................. 57<br />
Table 29: Baseline Tourism Data for 2015..................................................................................................................................................... 59<br />
Table 30: Damage and Losses in the Tourism Sector by Division (F$ million)................................................................................................. 60<br />
Table 31: Damage and Estimated Rebuilding Cost for the Tourism Sector by Division (F$ million)................................................................. 61<br />
Table 32: Total Recovery and Reconstruction Needs for the Tourism Sector (F$ million)............................................................................... 61<br />
Table 33: Quantification of Damage and Losses in the Mining Sector (F$ million).......................................................................................... 62<br />
Table 34: Damage to Key Assets in the Mining Sector.................................................................................................................................. 62<br />
Table 35: Losses in the Mining Sector........................................................................................................................................................... 63<br />
Table 36: Total Recovery and Reconstruction Needs for the Mining Sector (F$ million).................................................................................. 63<br />
Table 37: Number of Schools by Division (as of 2014).................................................................................................................................. 65<br />
Table 38: Damage and Losses in the Education Sector by Division (F$ million)............................................................................................. 66<br />
Table 39: Total Recovery and Reconstruction Needs for the Education Sector (F$ million)............................................................................ 67<br />
Table 40: Intermediate and Long-Term Reconstruction Costs for the Education Sector (F$ million)............................................................... 68<br />
Table 41: Health Facilities in <strong>Fiji</strong>..................................................................................................................................................................... 69<br />
Table 42: Damage and Losses to the Health Sector by Division (F$ million).................................................................................................. 70<br />
Table 43: Recovery and Reconstruction Needs for the Health Sector (F$ million).......................................................................................... 71<br />
Table 44: Housing Stock by Type of Wall Material and Distribution by Division.............................................................................................. 73<br />
Table 45: Damage to the Housing Sector (F$ million)................................................................................................................................... 74<br />
Table 46: Value and Number of Houses91 Destroyed or Damaged by Division............................................................................................. 74<br />
Table 47: Losses in the Housing Sector by Type (F$ million)......................................................................................................................... 75<br />
Table 48: Materials Grant for Different Levels of Damage in the Housing Sector............................................................................................ 77<br />
Table 49: Total Recovery and Reconstruction Needs for the Housing Sector (F$ million)............................................................................... 77<br />
Table 50: <strong>Fiji</strong> Road Authority Assets by Division............................................................................................................................................ 79<br />
Table 51: Damage and Losses in the Transport Sector (F$ million)............................................................................................................... 81<br />
Table 52: Damage and Losses in the Transport Sector by Division............................................................................................................... 81<br />
Table 53: Total Recovery and Reconstruction Needs for the Transport Sector (F$ million)............................................................................. 82<br />
Table 54: Water- and Sanitation-Related Infrastructure (number of facilities).................................................................................................. 83<br />
Table 55: Damage and Losses in the Water and Sanitation Sector by Subsector (F$ million)........................................................................ 84<br />
4 Tropical Cyclone Winston, February 20, 2016


