Fiji
yqgk302EGjo
yqgk302EGjo

Create successful ePaper yourself
Turn your PDF publications into a flip-book with our unique Google optimized e-Paper software.
FIJI Post-Disaster Needs Assessment<br />
Annex 5: Supplementary Material for the<br />
Housing Sector<br />
Methodology Used for Determining TC Winston Housing<br />
Sector Damage and Losses<br />
The process for estimating the effects of TC Winston on the residential housing stock has two steps: one, estimation of<br />
the baseline housing stock and its economic value; and, two, estimation of the effects on the housing stock following TC<br />
Winston. The analysis for the housing sector was carried out at the Tikina level (equivalent to the provincial level), later<br />
aggregated up to the divisional level.<br />
Estimated Breakdown of the Baseline Building Stock by<br />
Building Type<br />
The baseline building stock was estimated through use of 2007 Census data, which shows the breakdown of the number<br />
of households living in six different building typologies. This information was overlaid on the exposure data available from<br />
the PCRAFI data compiled in 2010 for estimating the total number of buildings. Population growth rates were derived for<br />
each Tikina using population census growth rates between 1996 and 2007. This growth rate was applied to the 2007<br />
census household data to estimate the 2010 average household numbers per building type per Tikina, from which the<br />
number of housing units per building type per Tikina were derived. This established the housing stock baseline for 2010,<br />
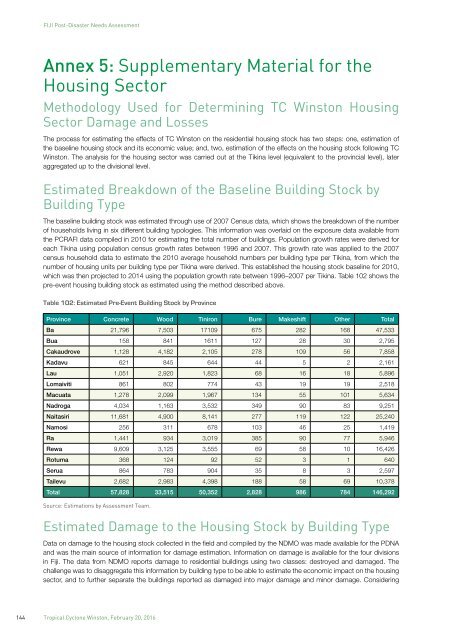
which was then projected to 2014 using the population growth rate between 1996–2007 per Tikina. Table 102 shows the<br />
pre-event housing building stock as estimated using the method described above.<br />
Table 102: Estimated Pre-Event Building Stock by Province<br />
Province Concrete Wood Tiniron Bure Makeshift Other Total<br />
Ba 21,796 7,503 17109 675 282 168 47,533<br />
Bua 158 841 1611 127 28 30 2,795<br />
Cakaudrove 1,128 4,182 2,105 278 109 56 7,858<br />
Kadavu 621 845 644 44 5 2 2,161<br />
Lau 1,051 2,920 1,823 68 16 18 5,896<br />
Lomaiviti 861 802 774 43 19 19 2,518<br />
Macuata 1,278 2,099 1,967 134 55 101 5,634<br />
Nadroga 4,034 1,163 3,532 349 90 83 9,251<br />
Naitasiri 11,681 4,900 8,141 277 119 122 25,240<br />
Namosi 256 311 678 103 46 25 1,419<br />
Ra 1,441 934 3,019 385 90 77 5,946<br />
Rewa 9,609 3,125 3,555 69 58 10 16,426<br />
Rotuma 368 124 92 52 3 1 640<br />
Serua 864 783 904 35 8 3 2,597<br />
Tailevu 2,682 2,983 4,398 188 58 69 10,378<br />
Total 57,828 33,515 50,352 2,828 986 784 146,292<br />
Source: Estimations by Assessment Team.<br />
Estimated Damage to the Housing Stock by Building Type<br />
Data on damage to the housing stock collected in the field and compiled by the NDMO was made available for the PDNA<br />
and was the main source of information for damage estimation. Information on damage is available for the four divisions<br />
in <strong>Fiji</strong>. The data from NDMO reports damage to residential buildings using two classes: destroyed and damaged. The<br />
challenge was to disaggregate this information by building type to be able to estimate the economic impact on the housing<br />
sector, and to further separate the buildings reported as damaged into major damage and minor damage. Considering<br />
144 Tropical Cyclone Winston, February 20, 2016