Fiji
yqgk302EGjo
yqgk302EGjo

You also want an ePaper? Increase the reach of your titles
YUMPU automatically turns print PDFs into web optimized ePapers that Google loves.
FIJI Post-Disaster Needs Assessment<br />
Businesses are estimated to have lost F$44 million through cancellations and future bookings. Losses due to additional<br />
operating costs appear to have been minimal, within the range of F$4 million. TC Winston will reduce visitor numbers by<br />
an estimated 3,700, or 0.5 percent, of annual arrivals during 2016, with the majority of the impact in the second quarter<br />
of the year.<br />
Given that TC Winston had a limited impact on the national tourism sector, recovery needs are relatively modest. The<br />
properties that constitute the majority of damage and losses are believed to be well insured. Based on initial insurance<br />
industry estimates and industry self-reporting, between F$12 million and F$29 million in damage and losses are uninsured.<br />
Accessing appropriate and affordable insurance products for smaller operators needs to be addressed. A smaller, but<br />
nevertheless important, need is to continue the positive messaging regarding <strong>Fiji</strong> being open for business in 2016.<br />
Tourism Sector Background<br />
Tourism has become a cornerstone of <strong>Fiji</strong>’s socioeconomic development over the past two decades. The sector consists<br />
of over 400 hotels, resorts and backpacker accommodations, located mainly around the Western Division islands of<br />
Savusavu, Taveuni, Mamanucas and Yasawas. 62 Direct tourism earnings as a percent of nominal GDP was an average of<br />
17.6 percent between 2011 (F$1.28 million) and 2015 63 (F$1.56 billion). Earnings fluctuate throughout the year depending<br />
on seasonality of tourist arrivals. The first quarter of the year is the trough season, while the third quarter of the year is the<br />
peak season (see Figure 20).<br />
Visitor arrivals increased from 675,050 in 2011 to an estimated all-time high of 754,835 in 2015. Australia, New Zealand<br />
and the United States are the three major source markets comprising 48.7 percent, 18.4 percent and 9 percent of total<br />
visitor arrivals, respectively, as of 2015. Other markets consisting of mainly China, continental Europe and Canada make<br />
up the remaining 23.9 percent.<br />
500.0<br />
400.0<br />
F$ million<br />
300.0<br />
200.0<br />
100.0<br />
0.0<br />
Mar Jun Sep Dec Mar Jun Sep Dec Mar Jun Sep Dec Mar Jun Sep Dec<br />
2012 2013(p)<br />
Quarterly<br />
2014(p)<br />
2015(p)<br />
Figure 20: Quarterly Tourism Earnings 2012–2015<br />
Source: Estimations by Assessment Team<br />
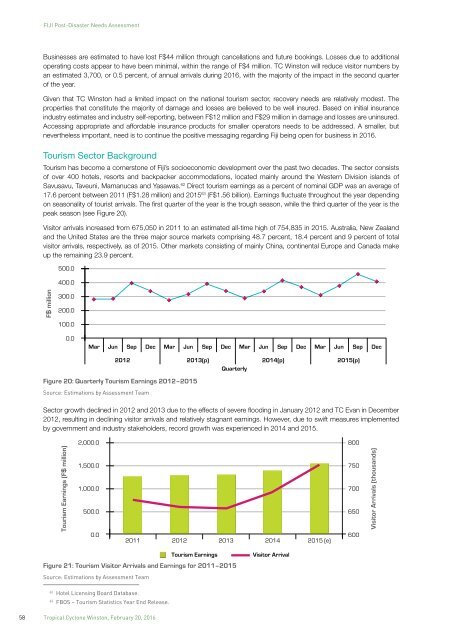
Sector growth declined in 2012 and 2013 due to the effects of severe flooding in January 2012 and TC Evan in December<br />
2012, resulting in declining visitor arrivals and relatively stagnant earnings. However, due to swift measures implemented<br />
by government and industry stakeholders, record growth was experienced in 2014 and 2015.<br />
Tourism Earnings (F$ million)<br />
2,000.0 800<br />
1,500.0 750<br />
1,000.0 700<br />
500.0 650<br />
0.0<br />
2011 2012 2013 2014 2015 (e)<br />
600<br />
Visitor Arrivals (thousands)<br />
Figure 21: Tourism Visitor Arrivals and Earnings for 2011–2015<br />
Source: Estimations by Assessment Team<br />
Tourism Earnings<br />
Visitor Arrival<br />
62<br />
Hotel Licensing Board Database.<br />
63<br />
FBOS – Tourism Statistics Year End Release.<br />
58 Tropical Cyclone Winston, February 20, 2016