Fiji
yqgk302EGjo
yqgk302EGjo

You also want an ePaper? Increase the reach of your titles
YUMPU automatically turns print PDFs into web optimized ePapers that Google loves.
FIJI Post-Disaster Needs Assessment<br />
2.1 Macroeconomic Impact<br />
2.1.1 Pre-Disaster Economic Outlook<br />
Gross Domestic Product<br />
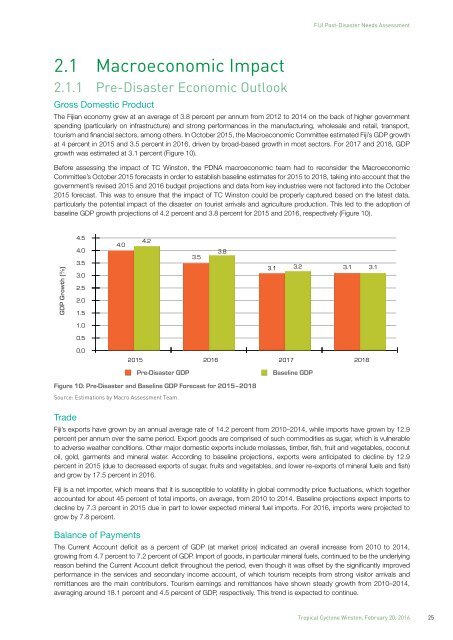
The <strong>Fiji</strong>an economy grew at an average of 3.8 percent per annum from 2012 to 2014 on the back of higher government<br />
spending (particularly on infrastructure) and strong performances in the manufacturing, wholesale and retail, transport,<br />
tourism and financial sectors, among others. In October 2015, the Macroeconomic Committee estimated <strong>Fiji</strong>’s GDP growth<br />
at 4 percent in 2015 and 3.5 percent in 2016, driven by broad-based growth in most sectors. For 2017 and 2018, GDP<br />
growth was estimated at 3.1 percent (Figure 10).<br />
Before assessing the impact of TC Winston, the PDNA macroeconomic team had to reconsider the Macroeconomic<br />
Committee’s October 2015 forecasts in order to establish baseline estimates for 2015 to 2018, taking into account that the<br />
government’s revised 2015 and 2016 budget projections and data from key industries were not factored into the October<br />
2015 forecast. This was to ensure that the impact of TC Winston could be properly captured based on the latest data,<br />
particularly the potential impact of the disaster on tourist arrivals and agriculture production. This led to the adoption of<br />
baseline GDP growth projections of 4.2 percent and 3.8 percent for 2015 and 2016, respectively (Figure 10).<br />
GDP Growth (%)<br />
4.5<br />
4.0<br />
3.5<br />
3.0<br />
2.5<br />
2.0<br />
1.5<br />
4.0<br />
4.2<br />
3.5<br />
3.8<br />
3.1 3.2 3.1 3.1<br />
1.0<br />
0.5<br />
Figure 10: Pre-Disaster and Baseline GDP Forecast for 2015–2018<br />
Source: Estimations by Macro Assessment Team.<br />
Trade<br />
0.0<br />
<strong>Fiji</strong>’s exports have grown by an annual average rate of 14.2 percent from 2010–2014, while imports have grown by 12.9<br />
percent per annum over the same period. Export goods are comprised of such commodities as sugar, which is vulnerable<br />
to adverse weather conditions. Other major domestic exports include molasses, timber, fish, fruit and vegetables, coconut<br />
oil, gold, garments and mineral water. According to baseline projections, exports were anticipated to decline by 12.9<br />
percent in 2015 (due to decreased exports of sugar, fruits and vegetables, and lower re-exports of mineral fuels and fish)<br />
and grow by 17.5 percent in 2016.<br />
<strong>Fiji</strong> is a net importer, which means that it is susceptible to volatility in global commodity price fluctuations, which together<br />
accounted for about 45 percent of total imports, on average, from 2010 to 2014. Baseline projections expect imports to<br />
decline by 7.3 percent in 2015 due in part to lower expected mineral fuel imports. For 2016, imports were projected to<br />
grow by 7.8 percent.<br />
Balance of Payments<br />
2015 2016 2017 2018<br />
Pre-Disaster GDP<br />
Baseline GDP<br />
The Current Account deficit as a percent of GDP (at market price) indicated an overall increase from 2010 to 2014,<br />
growing from 4.7 percent to 7.2 percent of GDP. Import of goods, in particular mineral fuels, continued to be the underlying<br />
reason behind the Current Account deficit throughout the period, even though it was offset by the significantly improved<br />
performance in the services and secondary income account, of which tourism receipts from strong visitor arrivals and<br />
remittances are the main contributors. Tourism earnings and remittances have shown steady growth from 2010–2014,<br />
averaging around 18.1 percent and 4.5 percent of GDP, respectively. This trend is expected to continue.<br />
Tropical Cyclone Winston, February 20, 2016<br />
25