Fiji
yqgk302EGjo
yqgk302EGjo
Create successful ePaper yourself
Turn your PDF publications into a flip-book with our unique Google optimized e-Paper software.
FIJI Post-Disaster Needs Assessment<br />
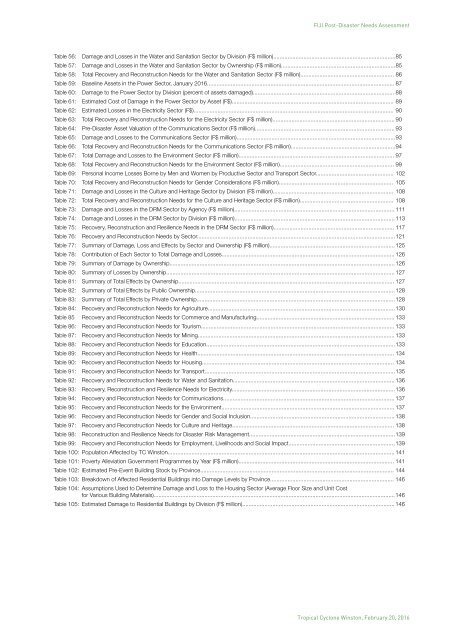
Table 56: Damage and Losses in the Water and Sanitation Sector by Division (F$ million)............................................................................. 85<br />
Table 57: Damage and Losses in the Water and Sanitation Sector by Ownership (F$ million)........................................................................ 85<br />
Table 58: Total Recovery and Reconstruction Needs for the Water and Sanitation Sector (F$ million)........................................................... 86<br />
Table 59: Baseline Assets in the Power Sector, January 2016...................................................................................................................... 87<br />
Table 60: Damage to the Power Sector by Division (percent of assets damaged)......................................................................................... 88<br />
Table 61: Estimated Cost of Damage in the Power Sector by Asset (F$)...................................................................................................... 89<br />
Table 62: Estimated Losses in the Electricity Sector (F$).............................................................................................................................. 90<br />
Table 63: Total Recovery and Reconstruction Needs for the Electricity Sector (F$ million)............................................................................. 90<br />
Table 64: Pre-Disaster Asset Valuation of the Communications Sector (F$ million)........................................................................................ 93<br />
Table 65: Damage and Losses to the Communications Sector (F$ million).................................................................................................... 93<br />
Table 66: Total Recovery and Reconstruction Needs for the Communications Sector (F$ million).................................................................. 94<br />
Table 67: Total Damage and Losses to the Environment Sector (F$ million).................................................................................................. 97<br />
Table 68: Total Recovery and Reconstruction Needs for the Environment Sector (F$ million)........................................................................ 99<br />
Table 69: Personal Income Losses Borne by Men and Women by Productive Sector and Transport Sector................................................. 102<br />
Table 70: Total Recovery and Reconstruction Needs for Gender Considerations (F$ million)........................................................................ 105<br />
Table 71: Damage and Losses in the Culture and Heritage Sector by Division (F$ million)............................................................................ 108<br />
Table 72: Total Recovery and Reconstruction Needs for the Culture and Heritage Sector (F$ million)........................................................... 108<br />
Table 73: Damage and Losses in the DRM Sector by Agency (F$ million)..................................................................................................... 111<br />
Table 74: Damage and Losses in the DRM Sector by Division (F$ million)..................................................................................................... 113<br />
Table 75: Recovery, Reconstruction and Resilience Needs in the DRM Sector (F$ million)............................................................................ 117<br />
Table 76: Recovery and Reconstruction Needs by Sector............................................................................................................................. 121<br />
Table 77: Summary of Damage, Loss and Effects by Sector and Ownership (F$ million)............................................................................... 125<br />
Table 78: Contribution of Each Sector to Total Damage and Losses............................................................................................................. 126<br />
Table 79: Summary of Damage by Ownership.............................................................................................................................................. 126<br />
Table 80: Summary of Losses by Ownership................................................................................................................................................ 127<br />
Table 81: Summary of Total Effects by Ownership........................................................................................................................................ 127<br />
Table 82: Summary of Total Effects by Public Ownership.............................................................................................................................. 128<br />
Table 83: Summary of Total Effects by Private Ownership............................................................................................................................. 128<br />
Table 84: Recovery and Reconstruction Needs for Agriculture...................................................................................................................... 130<br />
Table 85 Recovery and Reconstruction Needs for Commerce and Manufacturing....................................................................................... 133<br />
Table 86: Recovery and Reconstruction Needs for Tourism.......................................................................................................................... 133<br />
Table 87: Recovery and Reconstruction Needs for Mining............................................................................................................................ 133<br />
Table 88: Recovery and Reconstruction Needs for Education....................................................................................................................... 133<br />
Table 89: Recovery and Reconstruction Needs for Health............................................................................................................................ 134<br />
Table 90: Recovery and Reconstruction Needs for Housing......................................................................................................................... 134<br />
Table 91: Recovery and Reconstruction Needs for Transport........................................................................................................................ 135<br />
Table 92: Recovery and Reconstruction Needs for Water and Sanitation...................................................................................................... 136<br />
Table 93: Recovery, Reconstruction and Resilience Needs for Electricity....................................................................................................... 136<br />
Table 94: Recovery and Reconstruction Needs for Communications............................................................................................................ 137<br />
Table 95: Recovery and Reconstruction Needs for the Environment............................................................................................................. 137<br />
Table 96: Recovery and Reconstruction Needs for Gender and Social Inclusion........................................................................................... 138<br />
Table 97: Recovery and Reconstruction Needs for Culture and Heritage...................................................................................................... 138<br />
Table 98: Reconstruction and Resilience Needs for Disaster Risk Management............................................................................................ 139<br />
Table 99: Recovery and Reconstruction Needs for Employment, Livelihoods and Social Impact................................................................... 139<br />
Table 100: Population Affected by TC Winston............................................................................................................................................... 141<br />
Table 101: Poverty Alleviation Government Programmes by Year (F$ million).................................................................................................. 141<br />
Table 102: lEstimated Pre-Event Building Stock by Province.......................................................................................................................... 144<br />
Table 103: Breakdown of Affected Residential Buildings into Damage Levels by Province.............................................................................. 146<br />
Table 104: Assumptions Used to Determine Damage and Loss to the Housing Sector (Average Floor Size and Unit Cost<br />
for Various Building Materials)........................................................................................................................................................ 146<br />
Table 105: Estimated Damage to Residential Buildings by Division (F$ million)................................................................................................ 146<br />
Tropical Cyclone Winston, February 20, 2016<br />
5


