Fiji
yqgk302EGjo
yqgk302EGjo

Create successful ePaper yourself
Turn your PDF publications into a flip-book with our unique Google optimized e-Paper software.
FIJI Post-Disaster Needs Assessment<br />
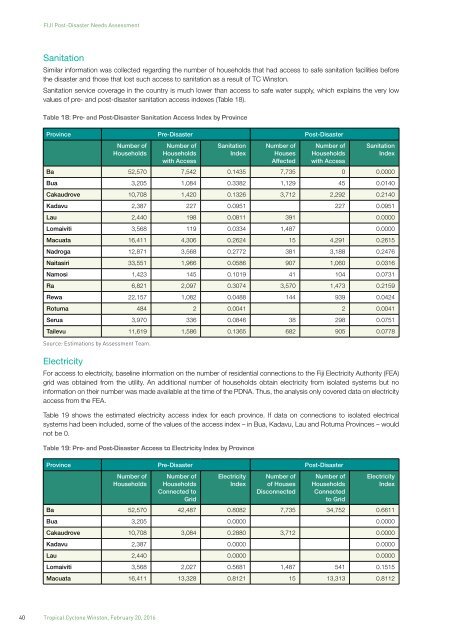
Sanitation<br />
Similar information was collected regarding the number of households that had access to safe sanitation facilities before<br />
the disaster and those that lost such access to sanitation as a result of TC Winston.<br />
Sanitation service coverage in the country is much lower than access to safe water supply, which explains the very low<br />
values of pre- and post-disaster sanitation access indexes (Table 18).<br />
Table 18: Pre- and Post-Disaster Sanitation Access Index by Province<br />
Province Pre-Disaster Post-Disaster<br />
Number of<br />
Households<br />
Number of<br />
Households<br />
with Access<br />
Sanitation<br />
Index<br />
Number of<br />
Houses<br />
Affected<br />
Number of<br />
Households<br />
with Access<br />
Sanitation<br />
Index<br />
Ba 52,570 7,542 0.1435 7,735 0 0.0000<br />
Bua 3,205 1,084 0.3382 1,129 45 0.0140<br />
Cakaudrove 10,708 1,420 0.1326 3,712 2,292 0.2140<br />
Kadavu 2,387 227 0.0951 227 0.0951<br />
Lau 2,440 198 0.0811 391 0.0000<br />
Lomaiviti 3,568 119 0.0334 1,487 0.0000<br />
Macuata 16,411 4,306 0.2624 15 4,291 0.2615<br />
Nadroga 12,871 3,568 0.2772 381 3,188 0.2476<br />
Naitasiri 33,551 1,966 0.0586 907 1,060 0.0316<br />
Namosi 1,423 145 0.1019 41 104 0.0731<br />
Ra 6,821 2,097 0.3074 3,570 1,473 0.2159<br />
Rewa 22,157 1,082 0.0488 144 939 0.0424<br />
Rotuma 484 2 0.0041 2 0.0041<br />
Serua 3,970 336 0.0846 38 298 0.0751<br />
Tailevu 11,619 1,586 0.1365 682 905 0.0778<br />
Source: Estimations by Assessment Team.<br />
Electricity<br />
For access to electricity, baseline information on the number of residential connections to the <strong>Fiji</strong> Electricity Authority (FEA)<br />
grid was obtained from the utility. An additional number of households obtain electricity from isolated systems but no<br />
information on their number was made available at the time of the PDNA. Thus, the analysis only covered data on electricity<br />
access from the FEA.<br />
Table 19 shows the estimated electricity access index for each province. If data on connections to isolated electrical<br />
systems had been included, some of the values of the access index – in Bua, Kadavu, Lau and Rotuma Provinces – would<br />
not be 0.<br />
Table 19: Pre- and Post-Disaster Access to Electricity Index by Province<br />
Province Pre-Disaster Post-Disaster<br />
Number of<br />
Households<br />
Number of<br />
Households<br />
Connected to<br />
Grid<br />
Electricity<br />
Index<br />
Number of<br />
of Houses<br />
Disconnected<br />
Number of<br />
Households<br />
Connected<br />
to Grid<br />
Electricity<br />
Index<br />
Ba 52,570 42,487 0.8082 7,735 34,752 0.6611<br />
Bua 3,205 0.0000 0.0000<br />
Cakaudrove 10,708 3,084 0.2880 3,712 0.0000<br />
Kadavu 2,387 0.0000 0.0000<br />
Lau 2,440 0.0000 0.0000<br />
Lomaiviti 3,568 2,027 0.5681 1,487 541 0.1515<br />
Macuata 16,411 13,328 0.8121 15 13,313 0.8112<br />
40 Tropical Cyclone Winston, February 20, 2016