Fiji
yqgk302EGjo
yqgk302EGjo

You also want an ePaper? Increase the reach of your titles
YUMPU automatically turns print PDFs into web optimized ePapers that Google loves.
FIJI Post-Disaster Needs Assessment<br />
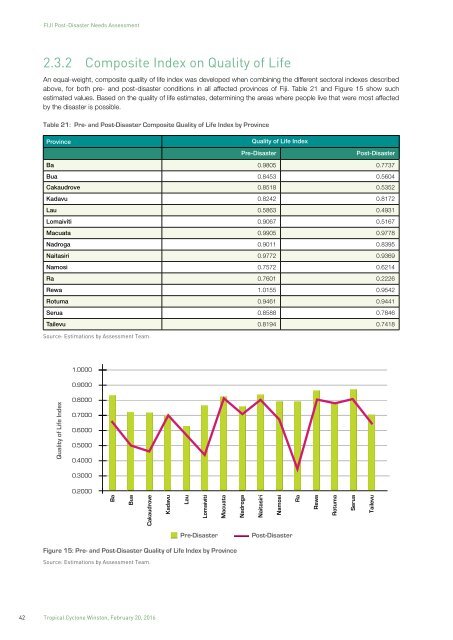
2.3.2 Composite Index on Quality of Life<br />
An equal-weight, composite quality of life index was developed when combining the different sectoral indexes described<br />
above, for both pre- and post-disaster conditions in all affected provinces of <strong>Fiji</strong>. Table 21 and Figure 15 show such<br />
estimated values. Based on the quality of life estimates, determining the areas where people live that were most affected<br />
by the disaster is possible.<br />
Table 21: Pre- and Post-Disaster Composite Quality of Life Index by Province<br />
Province<br />
Quality of Life Index<br />
Pre-Disaster<br />
Post-Disaster<br />
Ba 0.9805 0.7737<br />
Bua 0.8453 0.5604<br />
Cakaudrove 0.8518 0.5352<br />
Kadavu 0.8242 0.8172<br />
Lau 0.5863 0.4931<br />
Lomaiviti 0.9067 0.5167<br />
Macuata 0.9905 0.9778<br />
Nadroga 0.9011 0.8395<br />
Naitasiri 0.9772 0.9369<br />
Namosi 0.7572 0.6214<br />
Ra 0.7601 0.2226<br />
Rewa 1.0155 0.9542<br />
Rotuma 0.9461 0.9441<br />
Serua 0.8588 0.7846<br />
Tailevu 0.8194 0.7418<br />
Source: Estimations by Assessment Team.<br />
1.0000<br />
0.9000<br />
Quality of Life Index<br />
0.8000<br />
0.7000<br />
0.6000<br />
0.5000<br />
0.4000<br />
0.3000<br />
0.2000<br />
Ba<br />
Bua<br />
Cakaudrove<br />
Kadavu<br />
Lau<br />
Lomaiviti<br />
Macuata<br />
Nadroga<br />
Naitasiri<br />
Namosi<br />
Ra<br />
Rewa<br />
Rotuma<br />
Serua<br />
Tailevu<br />
Pre-Disaster<br />
Post-Disaster<br />
Figure 15: Pre- and Post-Disaster Quality of Life Index by Province<br />
Source: Estimations by Assessment Team.<br />
42 Tropical Cyclone Winston, February 20, 2016