Fiji
yqgk302EGjo
yqgk302EGjo

Create successful ePaper yourself
Turn your PDF publications into a flip-book with our unique Google optimized e-Paper software.
FIJI Post-Disaster Needs Assessment<br />
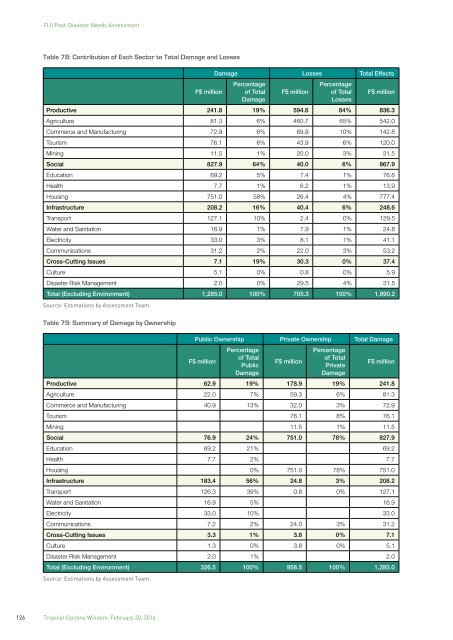
Table 78: Contribution of Each Sector to Total Damage and Losses<br />
F$ million<br />
Damage Losses Total Effects<br />
Percentage<br />
of Total<br />
Damage<br />
F$ million<br />
Percentage<br />
of Total<br />
Losses<br />
F$ million<br />
Productive 241.8 19% 594.6 84% 836.3<br />
Agriculture 81.3 6% 460.7 65% 542.0<br />
Commerce and Manufacturing 72.9 6% 69.9 10% 142.8<br />
Tourism 76.1 6% 43.9 6% 120.0<br />
Mining 11.5 1% 20.0 3% 31.5<br />
Social 827.9 64% 40.0 6% 867.9<br />
Education 69.2 5% 7.4 1% 76.6<br />
Health 7.7 1% 6.2 1% 13.9<br />
Housing 751.0 58% 26.4 4% 777.4<br />
Infrastructure 208.2 16% 40.4 6% 248.6<br />
Transport 127.1 10% 2.4 0% 129.5<br />
Water and Sanitation 16.9 1% 7.9 1% 24.8<br />
Electricity 33.0 3% 8.1 1% 41.1<br />
Communications 31.2 2% 22.0 3% 53.2<br />
Cross-Cutting Issues 7.1 19% 30.3 0% 37.4<br />
Culture 5.1 0% 0.8 0% 5.9<br />
Disaster Risk Management 2.0 0% 29.5 4% 31.5<br />
Total (Excluding Environment) 1,285.0 100% 705.3 100% 1,990.2<br />
Source: Estimations by Assessment Team.<br />
Table 79: Summary of Damage by Ownership<br />
Public Ownership Private Ownership Total Damage<br />
F$ million<br />
Percentage<br />
of Total<br />
Public<br />
Damage<br />
F$ million<br />
Percentage<br />
of Total<br />
Private<br />
Damage<br />
F$ million<br />
Productive 62.9 19% 178.9 19% 241.8<br />
Agriculture 22.0 7% 59.3 6% 81.3<br />
Commerce and Manufacturing 40.9 13% 32.0 3% 72.9<br />
Tourism 76.1 8% 76.1<br />
Mining 11.5 1% 11.5<br />
Social 76.9 24% 751.0 78% 827.9<br />
Education 69.2 21% 69.2<br />
Health 7.7 2% 7.7<br />
Housing 0% 751.0 78% 751.0<br />
Infrastructure 183.4 56% 24.8 3% 208.2<br />
Transport 126.3 39% 0.8 0% 127.1<br />
Water and Sanitation 16.9 5% 16.9<br />
Electricity 33.0 10% 33.0<br />
Communications 7.2 2% 24.0 3% 31.2<br />
Cross-Cutting Issues 3.3 1% 3.8 0% 7.1<br />
Culture 1.3 0% 3.8 0% 5.1<br />
Disaster Risk Management 2.0 1% 2.0<br />
Total (Excluding Environment) 326.5 100% 958.5 100% 1,285.0<br />
Source: Estimations by Assessment Team.<br />
126 Tropical Cyclone Winston, February 20, 2016