Fiji
yqgk302EGjo
yqgk302EGjo

You also want an ePaper? Increase the reach of your titles
YUMPU automatically turns print PDFs into web optimized ePapers that Google loves.
FIJI Post-Disaster Needs Assessment<br />
Province Pre-Disaster Post-Disaster<br />
Nadroga 0.8595 0.8242<br />
Naitasiri 0.8688 0.8375<br />
Namosi 1.0423 1.0122<br />
Ra 0.9228 0.3688<br />
Rewa 0.7873 0.7804<br />
Rotuma 0.6750 0.6750<br />
Serua 0.6851 0.6751<br />
Tailevu 0.9539 0.8913<br />
Source: Estimations by Assessment Team.<br />
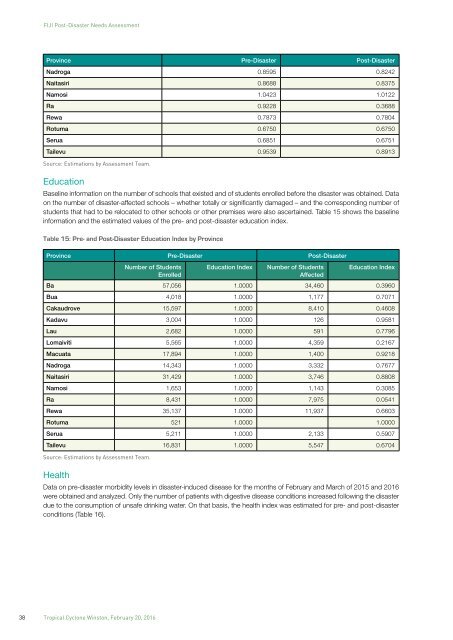
Education<br />
Baseline information on the number of schools that existed and of students enrolled before the disaster was obtained. Data<br />
on the number of disaster-affected schools – whether totally or significantly damaged – and the corresponding number of<br />
students that had to be relocated to other schools or other premises were also ascertained. Table 15 shows the baseline<br />
information and the estimated values of the pre- and post-disaster education index.<br />
Table 15: Pre- and Post-Disaster Education Index by Province<br />
Province Pre-Disaster Post-Disaster<br />
Number of Students<br />
Enrolled<br />
Education Index<br />
Number of Students<br />
Affected<br />
Education Index<br />
Ba 57,056 1.0000 34,460 0.3960<br />
Bua 4,018 1.0000 1,177 0.7071<br />
Cakaudrove 15,597 1.0000 8,410 0.4608<br />
Kadavu 3,004 1.0000 126 0.9581<br />
Lau 2,682 1.0000 591 0.7796<br />
Lomaiviti 5,565 1.0000 4,359 0.2167<br />
Macuata 17,894 1.0000 1,400 0.9218<br />
Nadroga 14,343 1.0000 3,332 0.7677<br />
Naitasiri 31,429 1.0000 3,746 0.8808<br />
Namosi 1,653 1.0000 1,143 0.3085<br />
Ra 8,431 1.0000 7,975 0.0541<br />
Rewa 35,137 1.0000 11,937 0.6603<br />
Rotuma 521 1.0000 1.0000<br />
Serua 5,211 1.0000 2,133 0.5907<br />
Tailevu 16,831 1.0000 5,547 0.6704<br />
Source: Estimations by Assessment Team.<br />
Health<br />
Data on pre-disaster morbidity levels in disaster-induced disease for the months of February and March of 2015 and 2016<br />
were obtained and analyzed. Only the number of patients with digestive disease conditions increased following the disaster<br />
due to the consumption of unsafe drinking water. On that basis, the health index was estimated for pre- and post-disaster<br />
conditions (Table 16).<br />
38 Tropical Cyclone Winston, February 20, 2016