Fiji
yqgk302EGjo
yqgk302EGjo

You also want an ePaper? Increase the reach of your titles
YUMPU automatically turns print PDFs into web optimized ePapers that Google loves.
FIJI Post-Disaster Needs Assessment<br />
Based on the values obtained for pre-disaster and post-disaster conditions for the above-listed sector indicators, and<br />
assigning equal weights to each, a composite indicator is developed that provides a measure of how the affected<br />
population’s quality of life deteriorated because of the disaster. Moreover, the estimated quality of life composite indicator<br />
may be used in the future as a measure of the degree of recovery being achieved over time.<br />
2.3.1 Quantification of Sectoral Quality of Life Indicators<br />
During the 2016 <strong>Fiji</strong> PDNA, existing sectoral baseline information and the estimated value of the main disaster effects were<br />
used to define quality of life.<br />
Housing<br />
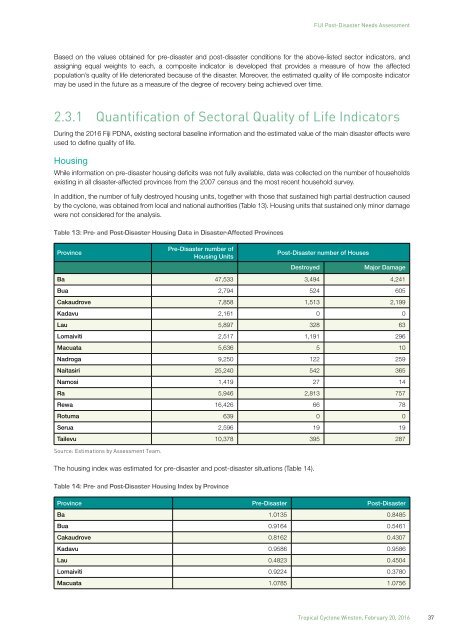
While information on pre-disaster housing deficits was not fully available, data was collected on the number of households<br />
existing in all disaster-affected provinces from the 2007 census and the most recent household survey.<br />
In addition, the number of fully destroyed housing units, together with those that sustained high partial destruction caused<br />
by the cyclone, was obtained from local and national authorities (Table 13). Housing units that sustained only minor damage<br />
were not considered for the analysis.<br />
Table 13: Pre- and Post-Disaster Housing Data in Disaster-Affected Provinces<br />
Province<br />
Pre-Disaster number of<br />
Housing Units<br />
Post-Disaster number of Houses<br />
Destroyed<br />
Major Damage<br />
Ba 47,533 3,494 4,241<br />
Bua 2,794 524 605<br />
Cakaudrove 7,858 1,513 2,199<br />
Kadavu 2,161 0 0<br />
Lau 5,897 328 63<br />
Lomaiviti 2,517 1,191 296<br />
Macuata 5,636 5 10<br />
Nadroga 9,250 122 259<br />
Naitasiri 25,240 542 365<br />
Namosi 1,419 27 14<br />
Ra 5,946 2,813 757<br />
Rewa 16,426 66 78<br />
Rotuma 639 0 0<br />
Serua 2,596 19 19<br />
Tailevu 10,378 395 287<br />
Source: Estimations by Assessment Team.<br />
The housing index was estimated for pre-disaster and post-disaster situations (Table 14).<br />
Table 14: Pre- and Post-Disaster Housing Index by Province<br />
Province Pre-Disaster Post-Disaster<br />
Ba 1.0135 0.8485<br />
Bua 0.9164 0.5461<br />
Cakaudrove 0.8162 0.4307<br />
Kadavu 0.9586 0.9586<br />
Lau 0.4823 0.4504<br />
Lomaiviti 0.9224 0.3780<br />
Macuata 1.0785 1.0756<br />
Tropical Cyclone Winston, February 20, 2016<br />
37