Fiji
yqgk302EGjo
yqgk302EGjo
Create successful ePaper yourself
Turn your PDF publications into a flip-book with our unique Google optimized e-Paper software.
FIJI Post-Disaster Needs Assessment<br />
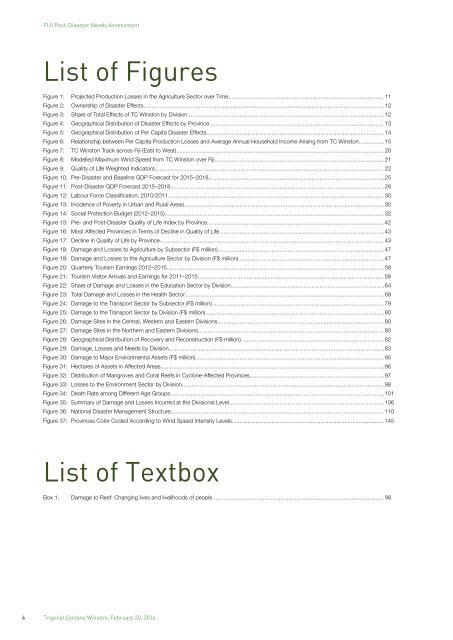
List of Figures<br />
Figure 1: Projected Production Losses in the Agriculture Sector over Time.................................................................................................. 11<br />
Figure 2: Ownership of Disaster Effects........................................................................................................................................................ 12<br />
Figure 3: Share of Total Effects of TC Winston by Division............................................................................................................................ 12<br />
Figure 4: Geographical Distribution of Disaster Effects by Province.............................................................................................................. 13<br />
Figure 5: Geographical Distribution of Per Capita Disaster Effects................................................................................................................ 14<br />
Figure 6: Relationship between Per Capita Production Losses and Average Annual Household Income Arising from TC Winston................ 15<br />
Figure 7: TC Winston Track across <strong>Fiji</strong> (East to West)................................................................................................................................... 20<br />
Figure 8: Modelled Maximum Wind Speed from TC Winston over <strong>Fiji</strong>........................................................................................................... 21<br />
Figure 9: Quality of Life Weighted Indicators................................................................................................................................................ 22<br />
Figure 10: Pre-Disaster and Baseline GDP Forecast for 2015–2018............................................................................................................... 25<br />
Figure 11: Post-Disaster GDP Forecast 2015–2018....................................................................................................................................... 26<br />
Figure 12: Labour Force Classification, 2010/2011........................................................................................................................................ 30<br />
Figure 13: Incidence of Poverty in Urban and Rural Areas.............................................................................................................................. 30<br />
Figure 14: Social Protection Budget (2012–2015).......................................................................................................................................... 32<br />
Figure 15: Pre- and Post-Disaster Quality of Life Index by Province................................................................................................................ 42<br />
Figure 16: Most Affected Provinces in Terms of Decline in Quality of Life........................................................................................................ 43<br />
Figure 17: Decline in Quality of Life by Province............................................................................................................................................. 43<br />
Figure 18: Damage and Losses to Agriculture by Subsector (F$ million)......................................................................................................... 47<br />
Figure 19: Damage and Losses to the Agriculture Sector by Division (F$ million)............................................................................................ 47<br />
Figure 20: Quarterly Tourism Earnings 2012–2015......................................................................................................................................... 58<br />
Figure 21: Tourism Visitor Arrivals and Earnings for 2011–2015..................................................................................................................... 58<br />
Figure 22: Share of Damage and Losses in the Education Sector by Division................................................................................................. 64<br />
Figure 23: Total Damage and Losses in the Health Sector.............................................................................................................................. 68<br />
Figure 24: Damage to the Transport Sector by Subsector (F$ million)............................................................................................................ 79<br />
Figure 25: Damage to the Transport Sector by Division (F$ million)................................................................................................................. 80<br />
Figure 26: Damage Sites in the Central, Western and Eastern Divisions......................................................................................................... 80<br />
Figure 27: Damage Sites in the Northern and Eastern Divisions..................................................................................................................... 80<br />
Figure 28: Geographical Distribution of Recovery and Reconstruction (F$ million).......................................................................................... 82<br />
Figure 29: Damage, Losses and Needs by Division........................................................................................................................................ 83<br />
Figure 30: Damage to Major Environmental Assets (F$ million)....................................................................................................................... 95<br />
Figure 31: Hectares of Assets in Affected Areas............................................................................................................................................. 96<br />
Figure 32: Distribution of Mangroves and Coral Reefs in Cyclone-Affected Provinces..................................................................................... 97<br />
Figure 33: Losses to the Environment Sector by Division............................................................................................................................... 98<br />
Figure 34: Death Rate among Different Age Groups....................................................................................................................................... 101<br />
Figure 35: Summary of Damage and Losses Incurred at the Divisional Level.................................................................................................. 106<br />
Figure 36: National Disaster Management Structure...................................................................................................................................... 110<br />
Figure 37: Provinces Color Coded According to Wind Speed Intensity Levels................................................................................................ 145<br />
List of Textbox<br />
Box 1: Damage to Reef: Changing lives and livelihoods of people............................................................................................................ 98<br />
6 Tropical Cyclone Winston, February 20, 2016


