


You also want an ePaper? Increase the reach of your titles
YUMPU automatically turns print PDFs into web optimized ePapers that Google loves.
<strong>QGIS</strong> <strong>for</strong> <strong>Archaeologists</strong> <strong>–</strong> A <strong>Basic</strong> <strong>Guide</strong><br />
We now have a map showing the distribution of Anti-Landing Trenches across the UK mainland, and<br />
counties in which Anti-Landing Trenches are preserved. However, if someone was looking at this<br />
map without us there to tell them more <strong>–</strong>they wouldn’t have a clue what it was about! To sort that<br />
out, let’s add some more map objects and make our data more accessible.<br />
11.2. 27BAdding a scalebar<br />
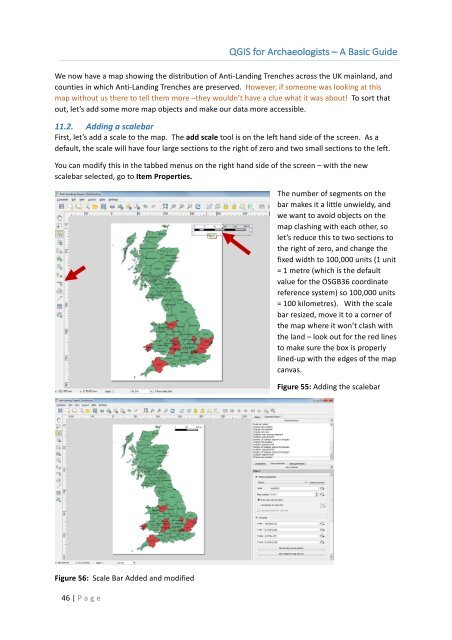
First, let’s add a scale to the map. The add scale tool is on the left hand side of the screen. As a<br />
default, the scale will have four large sections to the right of zero and two small sections to the left.<br />
You can modify this in the tabbed menus on the right hand side of the screen <strong>–</strong> with the new<br />
scalebar selected, go to Item Properties.<br />
The number of segments on the<br />
bar makes it a little unwieldy, and<br />
we want to avoid objects on the<br />
map clashing with each other, so<br />
let’s reduce this to two sections to<br />
the right of zero, and change the<br />
fixed width to 100,000 units (1 unit<br />
= 1 metre (which is the default<br />
value <strong>for</strong> the OSGB36 coordinate<br />
reference system) so 100,000 units<br />
= 100 kilometres). With the scale<br />
bar resized, move it to a corner of<br />
the map where it won’t clash with<br />
the land <strong>–</strong> look out <strong>for</strong> the red lines<br />
to make sure the box is properly<br />
lined-up with the edges of the map<br />
canvas.<br />
Figure 55: Adding the scalebar<br />
Figure 56: Scale Bar Added and modified<br />
46 | P age