

Economic Freedom of the World
economic-freedom-of-the-world-2016
economic-freedom-of-the-world-2016

Create successful ePaper yourself
Turn your PDF publications into a flip-book with our unique Google optimized e-Paper software.
242 • <strong>Economic</strong> <strong>Freedom</strong> <strong>of</strong> <strong>the</strong> <strong>World</strong>: 2016 Annual Report<br />
10<br />
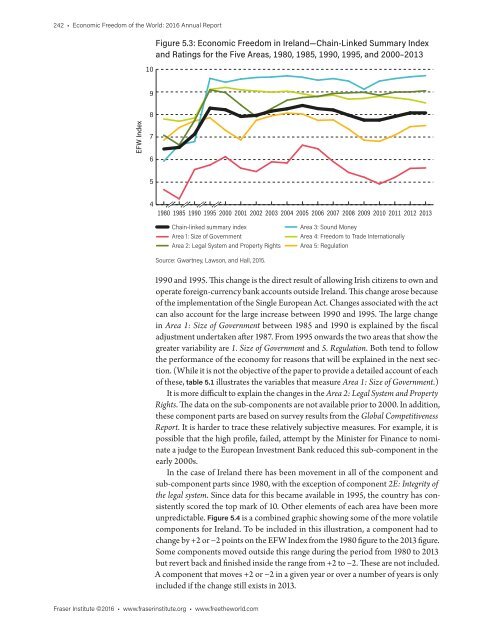
Figure 5.3: <strong>Economic</strong> <strong>Freedom</strong> in Ireland—Chain-Linked Summary Index<br />
and Ratings for <strong>the</strong> Five Areas, 1980, 1985, 1990, 1995, and 2000–2013<br />
9<br />
8<br />
EFW Index<br />
7<br />
6<br />
5<br />
4<br />
1980 1985 1990 1995 2000 2001 2002 2003 2004 2005 2006 2007 2008 2009 2010 2011 2012 2013<br />
Chain-linked summary index<br />
Area 1: Size <strong>of</strong> Government<br />
Area 2: Legal System and Property Rights<br />
Area 3: Sound Money<br />
Area 4: <strong>Freedom</strong> to Trade Internationally<br />
Area 5: Regulation<br />
Source: Gwartney, Lawson, and Hall, 2015.<br />
1990 and 1995. This change is <strong>the</strong> direct result <strong>of</strong> allowing Irish citizens to own and<br />
operate foreign-currency bank accounts outside Ireland. This change arose because<br />
<strong>of</strong> <strong>the</strong> implementation <strong>of</strong> <strong>the</strong> Single European Act. Changes associated with <strong>the</strong> act<br />
can also account for <strong>the</strong> large increase between 1990 and 1995. The large change<br />
in Area 1: Size <strong>of</strong> Government between 1985 and 1990 is explained by <strong>the</strong> fiscal<br />
adjustment undertaken after 1987. From 1995 onwards <strong>the</strong> two areas that show <strong>the</strong><br />
greater variability are 1. Size <strong>of</strong> Government and 5. Regulation. Both tend to follow<br />
<strong>the</strong> performance <strong>of</strong> <strong>the</strong> economy for reasons that will be explained in <strong>the</strong> next section.<br />
(While it is not <strong>the</strong> objective <strong>of</strong> <strong>the</strong> paper to provide a detailed account <strong>of</strong> each<br />
<strong>of</strong> <strong>the</strong>se, table 5.1 illustrates <strong>the</strong> variables that measure Area 1: Size <strong>of</strong> Government.)<br />
It is more difficult to explain <strong>the</strong> changes in <strong>the</strong> Area 2: Legal System and Property<br />
Rights. The data on <strong>the</strong> sub-components are not available prior to 2000. In addition,<br />
<strong>the</strong>se component parts are based on survey results from <strong>the</strong> Global Competitiveness<br />
Report. It is harder to trace <strong>the</strong>se relatively subjective measures. For example, it is<br />
possible that <strong>the</strong> high pr<strong>of</strong>ile, failed, attempt by <strong>the</strong> Minister for Finance to nominate<br />
a judge to <strong>the</strong> European Investment Bank reduced this sub-component in <strong>the</strong><br />
early 2000s.<br />
In <strong>the</strong> case <strong>of</strong> Ireland <strong>the</strong>re has been movement in all <strong>of</strong> <strong>the</strong> component and<br />
sub-component parts since 1980, with <strong>the</strong> exception <strong>of</strong> component 2E: Integrity <strong>of</strong><br />
<strong>the</strong> legal system. Since data for this became available in 1995, <strong>the</strong> country has consistently<br />
scored <strong>the</strong> top mark <strong>of</strong> 10. O<strong>the</strong>r elements <strong>of</strong> each area have been more<br />
unpredictable. Figure 5.4 is a combined graphic showing some <strong>of</strong> <strong>the</strong> more volatile<br />
components for Ireland. To be included in this illustration, a component had to<br />
change by +2 or −2 points on <strong>the</strong> EFW Index from <strong>the</strong> 1980 figure to <strong>the</strong> 2013 figure.<br />
Some components moved outside this range during <strong>the</strong> period from 1980 to 2013<br />
but revert back and finished inside <strong>the</strong> range from +2 to −2. These are not included.<br />
A component that moves +2 or −2 in a given year or over a number <strong>of</strong> years is only<br />
included if <strong>the</strong> change still exists in 2013.<br />
Fraser Institute ©2016 • www.fraserinstitute.org • www.free<strong>the</strong>world.com