- Page 1 and 2:
Understanding Acoustic Emission Tes
- Page 3 and 4:
Concrete Offshore structure Charlie
- Page 5 and 6:
Refinery Applications Charlie Chong
- Page 7 and 8:
Charlie Chong/ Fion Zhang
- Page 9 and 10:
The Magical Book of Acoustic Emissi
- Page 11 and 12:
ASNT Certification Guide NDT Level
- Page 13 and 14:
3 Techniques • Equipment calibrat
- Page 15 and 16:
Fion Zhang at Shanghai 3rd Septembe
- Page 17 and 18:
Charlie Chong/ Fion Zhang http://gr
- Page 19 and 20:
Video on - Leak Detection on Buried
- Page 21 and 22:
ASME V Article Numbers: Gen Article
- Page 23 and 24:
ASTM Standards E976 - 05 Standard G
- Page 25 and 26:
ASTM Standards E1781 - 08 Standard
- Page 27 and 28:
Typical AET Signal https://dspace.l
- Page 29 and 30:
Study Note 1: AET http://www.geocit
- Page 31 and 32:
Until about 1973, acoustic emission
- Page 33 and 34:
Charlie Chong/ Fion Zhang http://ww
- Page 35 and 36:
AE Technique The AE technique (AET)
- Page 37 and 38:
What is Normal (Gaussian) distribut
- Page 39 and 40:
Probability density function for th
- Page 41 and 42:
Cumulative distribution function of
- Page 43 and 44:
Crystal Twinning Crystal twinning o
- Page 45 and 46:
What is Crystal Twinning Crystal tw
- Page 47 and 48:
Crystal Twinning Charlie Chong/ Fio
- Page 49 and 50:
Crystal Twinning- Diagram of twinne
- Page 51 and 52:
AET Set-up Charlie Chong/ Fion Zhan
- Page 53 and 54:
Continuous type Charlie Chong/ Fion
- Page 55 and 56:
Discussion Subject: explains on the
- Page 57 and 58:
Kaiser Effect Plastic deformation i
- Page 59 and 60:
Felicity effect is an effect in aco
- Page 61 and 62:
Activity of AE Sources in Structura
- Page 63 and 64:
Felicity Effect - the applied load
- Page 65 and 66:
AE Parameters Various parameters us
- Page 67 and 68:
AET Advantages AE testing is a powe
- Page 69 and 70:
A Few Typical Applications • Dete
- Page 71 and 72:
Acoustic Emission Testing Advantage
- Page 73 and 74:
End of Reading 1 Charlie Chong/ Fio
- Page 75 and 76:
16 Acoustic Emission Methods Charli
- Page 77 and 78:
Charlie Chong/ Fion Zhang
- Page 79 and 80:
Foreword: Acoustic emission refers
- Page 81 and 82:
Acoustic emissions, which occur in
- Page 83 and 84:
At about the same time, but indepen
- Page 85 and 86:
Figure 1: A cube with sides of leng
- Page 87 and 88:
Green also noted the Kaiser effect,
- Page 89 and 90:
16.3 Theoretical Considerations Whe
- Page 91 and 92:
FIGURE 16.1 The two basic types of
- Page 93 and 94:
FIGURE 16.2 A typical acoustic emis
- Page 95 and 96:
FIGURE 16.3 Typical view of an acou
- Page 97 and 98:
1. The total number of counts (e.g.
- Page 99 and 100:
■ Rise time — This is the inter
- Page 101 and 102:
Energy analysis — This is an indi
- Page 103 and 104:
FIGURE 16.5 The main elements of a
- Page 105 and 106:
Fourier-Transform (FT) The Fourier
- Page 107 and 108:
Signal Evaluation: Analysis of the
- Page 109 and 110:
Signal Evaluation: Raise Time/ Even
- Page 111 and 112:
Signal Evaluation: Amplitude Distri
- Page 113 and 114:
Signal Evaluation: Energy analysis-
- Page 115 and 116:
Signal Evaluation: Raise Time/ Even
- Page 117 and 118:
FIGURE 16.5 The main elements of a
- Page 119 and 120:
A brief description of the most imp
- Page 121 and 122:
PZT:- If the p.d or the stress is c
- Page 123 and 124:
AET Transducer In 0.1KHz~2.0KHz Cha
- Page 125 and 126:
2. Preamplifier: Because of the low
- Page 127 and 128:
There are generally two (or more) c
- Page 129 and 130:
Spooner and Dougill confirmed that
- Page 131 and 132:
Spooner and Dougill conclusion on K
- Page 133 and 134:
16.6.3 Signal Attenuation The elast
- Page 135 and 136:
16.6.4 Specimen Geometry It has bee
- Page 137 and 138:
16.6.6 Concrete Strength It has bee
- Page 139 and 140:
16.7.1 Fracture Mechanics Studies A
- Page 141 and 142:
16.7.2 Type of Cracks A number of a
- Page 143 and 144:
They found that, while the number o
- Page 145 and 146:
Sadowska-Boczar et al. tried to qua
- Page 147 and 148:
FIGURE 16.7 Within-batch variabilit
- Page 149 and 150:
16.7.6 Fiber Reinforced Cements and
- Page 151 and 152:
Fiber Reinforced Cements and Concre
- Page 153 and 154:
Perhaps the most extensive series o
- Page 155 and 156:
16.7.8 Thermal Cracking Relatively
- Page 157 and 158:
They found that acoustic emissions
- Page 159 and 160:
Corrosion of Reinforcing Steel in C
- Page 161 and 162:
16.8 Field Studies of Acoustic Emis
- Page 163 and 164:
16.9 Conclusions From the discussio
- Page 165 and 166:
Concrete Structures Charlie Chong/
- Page 167 and 168:
Concrete Structures Charlie Chong/
- Page 169 and 170:
Concrete Structures- The Troll A pl
- Page 171 and 172:
Concrete Structures- The Troll A pl
- Page 173 and 174:
End of Reading 2 Charlie Chong/ Fio
- Page 175 and 176:
1.0 Introduction Acoustic Emission
- Page 177 and 178:
Twinning Charlie Chong/ Fion Zhang
- Page 179 and 180:
Acoustic Emission is unlike most ot
- Page 181 and 182:
2.0 A Brief History of AE Testing A
- Page 183 and 184:
3.0 Theory - AE Sources As mentione
- Page 185 and 186:
The amount of energy released by an
- Page 187 and 188:
Activity of AE Sources in Structura
- Page 189 and 190:
Kaiser/Felicity effects Felicity ef
- Page 191 and 192:
Dunegan corollary states that if ac
- Page 193 and 194:
Comments: Emissions are observed pr
- Page 195 and 196:
Pseudo Sources In addition to the A
- Page 197 and 198:
Wave Propagation A primitive wave r
- Page 199 and 200:
Waves radiates from the source in a
- Page 201 and 202:
Angular dependence of acoustic emis
- Page 203 and 204:
The signal that is detected by a se
- Page 205 and 206:
highly damped, nonmetallic material
- Page 207 and 208:
Attenuation: 1. Spread (30% for 2D,
- Page 209 and 210:
Teflon shoe http://www.ndt.net/ndta
- Page 211 and 212:
Lamb waves in acoustic emission tes
- Page 213 and 214:
2.2.5 Rayleigh Characteristics Rayl
- Page 215 and 216:
Q29: The longitudinal wave incident
- Page 217 and 218:
The major axis of the ellipse is pe
- Page 219 and 220:
Surface wave Charlie Chong/ Fion Zh
- Page 221 and 222: Surface wave has the ability to fol
- Page 223 and 224: Surface wave - One wavelength deep
- Page 225 and 226: Rayleigh Wave Charlie Chong/ Fion Z
- Page 227 and 228: Love Wave Charlie Chong/ Fion Zhang
- Page 229 and 230: Other Reading: Rayleigh Waves Surfa
- Page 231 and 232: Q110: What kind of wave mode travel
- Page 233 and 234: Q192: Surface waves are reduced to
- Page 235 and 236: Since the 1990s, the understanding
- Page 237 and 238: Plate or Lamb waves are the most co
- Page 239 and 240: Plate wave or Lamb wave are formed
- Page 241 and 242: When guided in layers they are refe
- Page 243 and 244: Symmetrical = extensional mode Asym
- Page 245 and 246: Other Reading: Lamb Wave Lamb waves
- Page 247 and 248: Fig. 4 Diagram of the basic pattern
- Page 249 and 250: 2.2.7 Dispersive Wave: Wave modes s
- Page 251 and 252: Discussion Subject: Wave Mode and V
- Page 253 and 254: Key Points: • Two classes: resona
- Page 255 and 256: Q. The most common range of acousti
- Page 257 and 258: Equipment- Probe Charlie Chong/ Fio
- Page 259 and 260: Schematic Diagram of a Basic Four-c
- Page 261 and 262: After passing the AE system mainfra
- Page 263 and 264: AET Charlie Chong/ Fion Zhang
- Page 265 and 266: 6.0 AE Signal Features With the equ
- Page 267 and 268: Amplitude, A, is the greatest measu
- Page 269 and 270: 7.0 Data Display Software-based AE
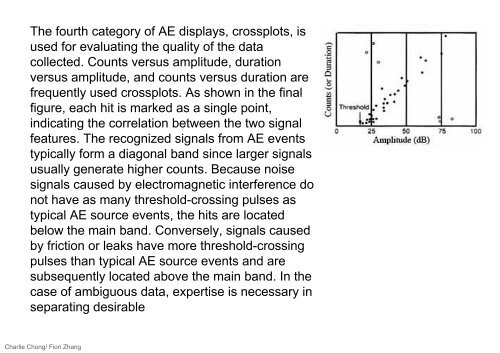
- Page 271: Intensity displays are used to give
- Page 275 and 276: Source location techniques assume t
- Page 277 and 278: Because the above scenario implicit
- Page 279 and 280: When additional sensors are applied
- Page 281 and 282: 9.0 AE Barkhausen Techniques The Ba
- Page 283 and 284: Hysterisis Loop- magnetization or d
- Page 285 and 286: ■ Bucket Truck (Cherry Pickers) I
- Page 287 and 288: ■ Gas Trailer Tubes Acoustic emis
- Page 289 and 290: ■ Aerospace Structures Most aeros
- Page 291 and 292: Others • Fiber-reinforced polymer
- Page 293 and 294: Study Note 4: ASTM E1316 Term & Def
- Page 295 and 296: • acoustic emission (AE)- the cla
- Page 297 and 298: • acoustic emission signature (si
- Page 299 and 300: • array, n- a group of two or mor
- Page 301 and 302: • continuous emission- see emissi
- Page 303 and 304: • dB AE - a logarithmic measure o
- Page 305 and 306: AE signal amplitude measured as a r
- Page 307 and 308: • distribution, differential (aco
- Page 309 and 310: effective velocity, n- velocity cal
- Page 311 and 312: FIG. 1 Burst Emission on a Continuo
- Page 313 and 314: FIG. 3 Continuous Emission. (Sweep
- Page 315 and 316: examination area- that portion of a
- Page 317 and 318: Kaiser effect- the absence of detec
- Page 319 and 320: Linear, Planar, 3D Linear 3D Planar
- Page 321 and 322: location, continuous AE signal, n-
- Page 323 and 324:
Methods of Location • Hit method
- Page 325 and 326:
logarithmic (acoustic emission) amp
- Page 327 and 328:
signal overload level- that level a
- Page 329 and 330:
stimulation- the application of a s
- Page 331 and 332:
End of Reading 4 Charlie Chong/ Fio
- Page 333 and 334:
Q1. The most common range of acoust
- Page 335 and 336:
Q5. The felicity effect is useful i
- Page 337 and 338:
Q9. Threshold settings are determin
- Page 339 and 340:
Q12. What is the Felicity Effect? A
- Page 341 and 342:
Q15. A Hsu-Nielson Source: A. measu
- Page 343 and 344:
Q19. The term ""rise time"" refers
- Page 345 and 346:
Q23. Four types of AE Source Locati
- Page 347 and 348:
Study Note 6: High Strength Steel-
- Page 349 and 350:
The properties of different steels
- Page 351 and 352:
Keywords: • DP (dual phase), •
- Page 353 and 354:
Figure 1: Ductility-strength relati
- Page 355 and 356:
However, with conventional TRIP ste
- Page 357 and 358:
Back to Basic: Martensite Martensit
- Page 359 and 360:
Keywords: Hexagonal & BCC Martensit
- Page 361 and 362:
Figure 2: The stress-strain diagram
- Page 363 and 364:
Also, the TRIP steel is particularl
- Page 365 and 366:
Figure 3: The diagram shows the ver
- Page 367 and 368:
Table 1: Effect of alloying element
- Page 369 and 370:
■ B, Ti, Zr Adding small amounts
- Page 371 and 372:
Acoustic Emission Technique the opt
- Page 373 and 374:
ASM introduction Since 1908, ASM is
- Page 375 and 376:
Active approach to leak detection T
- Page 377 and 378:
Leak detection and location The mod
- Page 379 and 380:
■ Method of testing (Linear) The
- Page 381 and 382:
Fig 2: Cross-correlation function p
- Page 383 and 384:
The figure 1 shows how the position
- Page 385 and 386:
Area surveys using acoustic loggers
- Page 387 and 388:
The reading of an area meter could
- Page 389 and 390:
CONCLUSIONS In the last fifteen yea
- Page 391 and 392:
■ ωσμ∙Ωπ∆ ∇ º≠δ≤
- Page 393 and 394:
Charlie Chong/ Fion Zhang
- Page 395 and 396:
Peach - 我 爱 桃 子 Charlie Cho
- Page 397 and 398:
Good Luck Charlie Chong/ Fion Zhang
- Page 399:
Charlie Chong/ Fion Zhang


