WASH’ Nutrition
manuel_wash_nutrition_online
manuel_wash_nutrition_online
You also want an ePaper? Increase the reach of your titles
YUMPU automatically turns print PDFs into web optimized ePapers that Google loves.
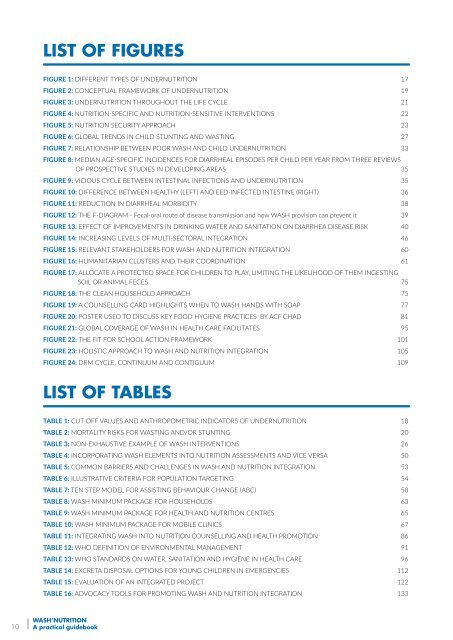
LIST OF FIGURES<br />
Figure 1: Different types of undernutrition 17<br />
Figure 2: Conceptual Framework of undernutrition 19<br />
Figure 3: Undernutrition throughout the life cycle 21<br />
Figure 4: <strong>Nutrition</strong>-specific and <strong>Nutrition</strong>-sensitive interventions 22<br />
Figure 5: <strong>Nutrition</strong> security approach 23<br />
FIGURE 6: Global trends in child stunting and wasting 27<br />
Figure 7: Relationship between poor WASH and child undernutrition 33<br />
Figure 8: Median age-specific incidences for diarrheal episodes per child per year from three reviews<br />
of prospective studies in developing areas 35<br />
Figure 9: Vicious CYCLE BETWEEN intestinal infections AND UNDERnutrition 35<br />
Figure 10: Difference between healthy (left) and EED-infected intestine (right) 36<br />
Figure 11: REDUCTION IN DIARRHEAL MORBIDITY 38<br />
Figure 12: The F-diagram - Fecal-oral route of disease transmission and how WASH provision can prevent it 39<br />
Figure 13: Effect of improvements in drinking water and sanitation on diarrhea disease risk 40<br />
Figure 14: Increasing levels of multi-sectoral integration 46<br />
FIGURE 15: Relevant stakeholders for WASH and nutrition integration 60<br />
FIGURE 16: Humanitarian clusters and their coordination 61<br />
Figure 17: Allocate a protected space for children to play, limiting the likelihood of them ingesting<br />
soil or animal feces 75<br />
Figure 18: The Clean Household Approach 75<br />
Figure 19: A counselling card highlights when to wash hands with soap 77<br />
Figure 20: Poster used to discuss key food hygiene practices BY ACF CHAD 81<br />
Figure 21: Global coverage of WASH in health care facilitates 95<br />
FIGURE 22: The Fit for School Action Framework 101<br />
Figure 23: Holistic approach to WASH and nutrition integration 105<br />
Figure 24: DRM cycle, continuum and contiguum 109<br />
LIST OF TABLES<br />
Table 1: Cut-off values and anthropometric indicators of undernutrition 18<br />
Table 2: Mortality risks for wasting and/or stunting 20<br />
Table 3: Non-exhaustive example of WASH interventions 26<br />
Table 4: Incorporating WASH elements into nutrition assessments and vice versa 50<br />
Table 5: Common barriers and challenges in WASH and nutrition integration 53<br />
Table 6: Illustrative criteria for population targeting 54<br />
TABLE 7: Ten step model for Assisting behaviour Change (ABC) 58<br />
Table 8: WASH minimum package for households 63<br />
Table 9: WASH Minimum package for health and nutrition centres 65<br />
Table 10: WASH Minimum package for mobile clinics 67<br />
Table 11: Integrating WASH into nutrition counselling and health promotion 86<br />
Table 12: WHO definition of environmental management 91<br />
Table 13: WHO standards on water, sanitation and hygiene in health care 96<br />
Table 14: Excreta disposal options for young children in emergencies 112<br />
Table 15: Evaluation of an integrated project 122<br />
Table 16: Advocacy tools for promoting WASH and nutrition integration 133<br />
10<br />
<strong>WASH’</strong><strong>Nutrition</strong><br />
A practical guidebook


