WASH’ Nutrition
manuel_wash_nutrition_online
manuel_wash_nutrition_online

Create successful ePaper yourself
Turn your PDF publications into a flip-book with our unique Google optimized e-Paper software.
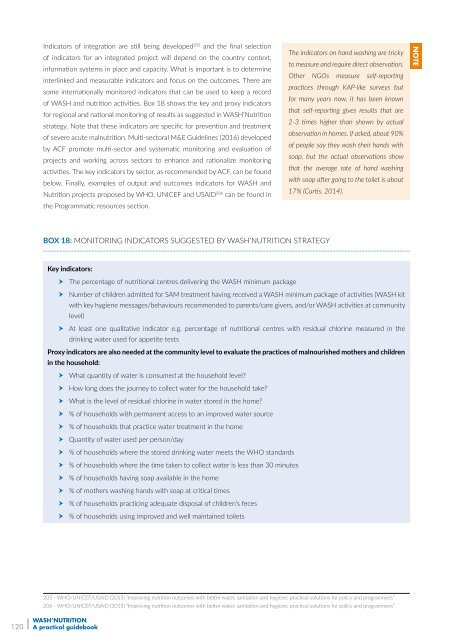
Indicators of integration are still being developed 205 and the final selection<br />
of indicators for an integrated project will depend on the country context,<br />
information systems in place and capacity. What is important is to determine<br />
interlinked and measurable indicators and focus on the outcomes. There are<br />
some internationally monitored indicators that can be used to keep a record<br />
of WASH and nutrition activities. Box 18 shows the key and proxy indicators<br />
for regional and national monitoring of results as suggested in <strong>WASH’</strong><strong>Nutrition</strong><br />
strategy. Note that these indicators are specific for prevention and treatment<br />
of severe acute malnutrition. Multi-sectoral M&E Guidelines (2016) developed<br />
by ACF promote multi-sector and systematic monitoring and evaluation of<br />
projects and working across sectors to enhance and rationalize monitoring<br />
activities. The key indicators by sector, as recommended by ACF, can be found<br />
below. Finally, examples of output and outcomes indicators for WASH and<br />
<strong>Nutrition</strong> projects proposed by WHO, UNICEF and USAID 206 can be found in<br />
the Programmatic resources section.<br />
The indicators on hand washing are tricky<br />
to measure and require direct observation.<br />
Other NGOs measure self-reporting<br />
practices through KAP-like surveys but<br />
for many years now, it has been known<br />
that self-reporting gives results that are<br />
2-3 times higher than shown by actual<br />
observation in homes. If asked, about 90%<br />
of people say they wash their hands with<br />
soap, but the actual observations show<br />
that the average rate of hand washing<br />
with soap after going to the toilet is about<br />
17% (Curtis, 2014).<br />
NOTE<br />
BOX 18: Monitoring indicators suggested by <strong>WASH’</strong><strong>Nutrition</strong> strategy<br />
Key indicators:<br />
The percentage of nutritional centres delivering the WASH minimum package<br />
Number of children admitted for SAM treatment having received a WASH minimum package of activities (WASH kit<br />
with key hygiene messages/behaviours recommended to parents/care givers, and/or WASH activities at community<br />
level)<br />
At least one qualitative indicator e.g. percentage of nutritional centres with residual chlorine measured in the<br />
drinking water used for appetite tests<br />
Proxy indicators are also needed at the community level to evaluate the practices of malnourished mothers and children<br />
in the household:<br />
What quantity of water is consumed at the household level?<br />
How long does the journey to collect water for the household take?<br />
What is the level of residual chlorine in water stored in the home?<br />
% of households with permanent access to an improved water source<br />
% of households that practice water treatment in the home<br />
Quantity of water used per person/day<br />
% of households where the stored drinking water meets the WHO standards<br />
% of households where the time taken to collect water is less than 30 minutes<br />
% of households having soap available in the home<br />
% of mothers washing hands with soap at critical times<br />
% of households practicing adequate disposal of children’s feces<br />
% of households using improved and well maintained toilets<br />
205 - WHO/UNICEF/USAID (2015) “Improving nutrition outcomes with better water, sanitation and hygiene: practical solutions for policy and programmers”<br />
206 - WHO/UNICEF/USAID (2015) “Improving nutrition outcomes with better water, sanitation and hygiene: practical solutions for policy and programmers”<br />
120<br />
<strong>WASH’</strong><strong>Nutrition</strong><br />
A practical guidebook