WASH’ Nutrition
manuel_wash_nutrition_online
manuel_wash_nutrition_online

Create successful ePaper yourself
Turn your PDF publications into a flip-book with our unique Google optimized e-Paper software.
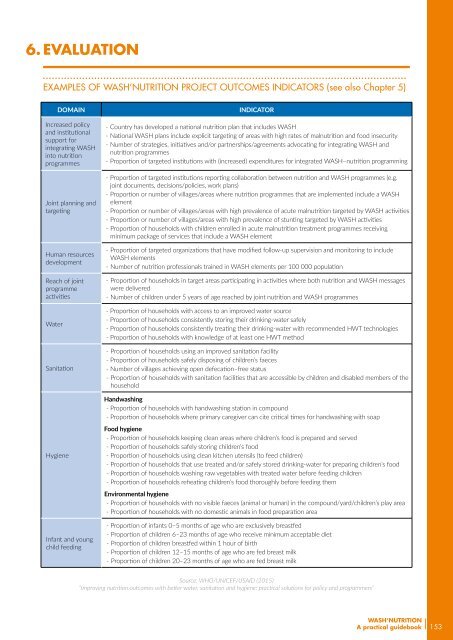
6. EVALUATION<br />
Examples of <strong>WASH’</strong><strong>Nutrition</strong> PROJECT outcomes indicators (see also Chapter 5)<br />
Domain<br />
Increased policy<br />
and institutional<br />
support for<br />
integrating WASH<br />
into nutrition<br />
programmes<br />
Joint planning and<br />
targeting<br />
Human resources<br />
development<br />
Reach of joint<br />
programme<br />
activities<br />
Water<br />
Sanitation<br />
Indicator<br />
- Country has developed a national nutrition plan that includes WASH<br />
- National WASH plans include explicit targeting of areas with high rates of malnutrition and food insecurity<br />
- Number of strategies, initiatives and/or partnerships/agreements advocating for integrating WASH and<br />
nutrition programmes<br />
- Proportion of targeted institutions with (increased) expenditures for integrated WASH–nutrition programming<br />
- Proportion of targeted institutions reporting collaboration between nutrition and WASH programmes (e.g.<br />
joint documents, decisions/policies, work plans)<br />
- Proportion or number of villages/areas where nutrition programmes that are implemented include a WASH<br />
element<br />
- Proportion or number of villages/areas with high prevalence of acute malnutrition targeted by WASH activities<br />
- Proportion or number of villages/areas with high prevalence of stunting targeted by WASH activities<br />
- Proportion of households with children enrolled in acute malnutrition treatment programmes receiving<br />
minimum package of services that include a WASH element<br />
- Proportion of targeted organizations that have modified follow-up supervision and monitoring to include<br />
WASH elements<br />
- Number of nutrition professionals trained in WASH elements per 100 000 population<br />
- Proportion of households in target areas participating in activities where both nutrition and WASH messages<br />
were delivered<br />
- Number of children under 5 years of age reached by joint nutrition and WASH programmes<br />
- Proportion of households with access to an improved water source<br />
- Proportion of households consistently storing their drinking-water safely<br />
- Proportion of households consistently treating their drinking-water with recommended HWT technologies<br />
- Proportion of households with knowledge of at least one HWT method<br />
- Proportion of households using an improved sanitation facility<br />
- Proportion of households safely disposing of children’s faeces<br />
- Number of villages achieving open defecation–free status<br />
- Proportion of households with sanitation facilities that are accessible by children and disabled members of the<br />
household<br />
Handwashing<br />
- Proportion of households with handwashing station in compound<br />
- Proportion of households where primary caregiver can cite critical times for handwashing with soap<br />
Hygiene<br />
Food hygiene<br />
- Proportion of households keeping clean areas where children’s food is prepared and served<br />
- Proportion of households safely storing children’s food<br />
- Proportion of households using clean kitchen utensils (to feed children)<br />
- Proportion of households that use treated and/or safely stored drinking-water for preparing children’s food<br />
- Proportion of households washing raw vegetables with treated water before feeding children<br />
- Proportion of households reheating children’s food thoroughly before feeding them<br />
Environmental hygiene<br />
- Proportion of households with no visible faeces (animal or human) in the compound/yard/children’s play area<br />
- Proportion of households with no domestic animals in food preparation area<br />
Infant and young<br />
child feeding<br />
- Proportion of infants 0–5 months of age who are exclusively breastfed<br />
- Proportion of children 6–23 months of age who receive minimum acceptable diet<br />
- Proportion of children breastfed within 1 hour of birth<br />
- Proportion of children 12–15 months of age who are fed breast milk<br />
- Proportion of children 20–23 months of age who are fed breast milk<br />
Source: WHO/UNICEF/USAID (2015)<br />
“Improving nutrition outcomes with better water, sanitation and hygiene: practical solutions for policy and programmers”<br />
<strong>WASH’</strong><strong>Nutrition</strong><br />
A practical guidebook<br />
153