Supervisory Banking Statistics
supervisorybankingstatistics_third_quarter_2016_201701.en
supervisorybankingstatistics_third_quarter_2016_201701.en

You also want an ePaper? Increase the reach of your titles
YUMPU automatically turns print PDFs into web optimized ePapers that Google loves.
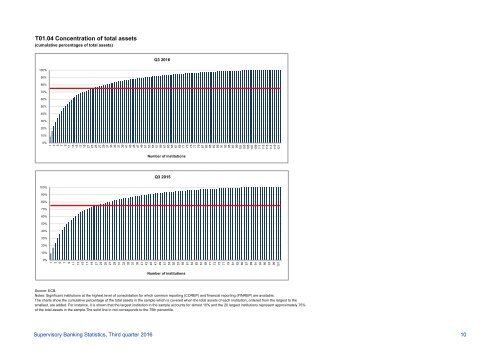
T01.04 Concentration of total assets<br />
(cumulative percentages of total assets)<br />
Q3 2016<br />
100%<br />
90%<br />
80%<br />
70%<br />
60%<br />
50%<br />
40%<br />
30%<br />
20%<br />
10%<br />
0%<br />
9<br />
11<br />
13<br />
15<br />
17<br />
19<br />
21<br />
23<br />
25<br />
27<br />
29<br />
31<br />
33<br />
35<br />
37<br />
39<br />
41<br />
43<br />
45<br />
47<br />
49<br />
51<br />
53<br />
55<br />
57<br />
59<br />
61<br />
63<br />
65<br />
67<br />
69<br />
71<br />
73<br />
75<br />
77<br />
79<br />
81<br />
83<br />
85<br />
87<br />
89<br />
91<br />
93<br />
95<br />
97<br />
99<br />
101<br />
103<br />
105<br />
107<br />
109<br />
111<br />
113<br />
115<br />
117<br />
119<br />
121<br />
1<br />
3<br />
5<br />
7<br />
Number of institutions<br />
Q3 2015<br />
100%<br />
90%<br />
80%<br />
70%<br />
60%<br />
50%<br />
40%<br />
30%<br />
20%<br />
10%<br />
0%<br />
1<br />
3<br />
5<br />
7<br />
9<br />
11<br />
13<br />
15<br />
17<br />
19<br />
21<br />
23<br />
25<br />
27<br />
29<br />
31<br />
33<br />
35<br />
37<br />
39<br />
41<br />
43<br />
45<br />
47<br />
49<br />
51<br />
53<br />
55<br />
57<br />
59<br />
61<br />
63<br />
65<br />
67<br />
69<br />
71<br />
73<br />
75<br />
77<br />
79<br />
81<br />
83<br />
85<br />
87<br />
89<br />
91<br />
93<br />
95<br />
97<br />
99<br />
101<br />
Number of institutions<br />
Source: ECB.<br />
Notes: Significant institutions at the highest level of consolidation for which common reporting (COREP) and financial reporting (FINREP) are available.<br />
The charts show the cumulative percentage of the total assets in the sample which is covered when the total assets of each institution, ordered from the largest to the<br />
smallest, are added. For instance, it is shown that the largest institution in the sample accounts for almost 10% and the 20 largest institutions represent approximately 75%<br />
of the total assets in the sample.The solid line in red corresponds to the 75th percentile.<br />
<strong>Supervisory</strong> <strong>Banking</strong> <strong>Statistics</strong>, Third quarter 2016 10