Supervisory Banking Statistics
supervisorybankingstatistics_third_quarter_2016_201701.en
supervisorybankingstatistics_third_quarter_2016_201701.en

Create successful ePaper yourself
Turn your PDF publications into a flip-book with our unique Google optimized e-Paper software.
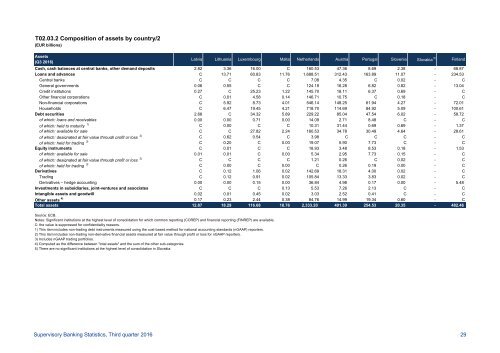
T02.03.2 Composition of assets by country/2<br />
(EUR billions)<br />
Assets<br />
(Q3 2016)<br />
Latvia Lithuania Luxembourg Malta Netherlands Austria Portugal Slovenia Slovakia 5) Finland<br />
Cash, cash balances at central banks, other demand deposits 2.82 3.36 16.00 C 160.53 47.36 8.69 2.38 - 68.87<br />
Loans and advances C 13.71 60.83 11.76 1,688.51 312.43 163.89 11.07 - 234.53<br />
Central banks C C C C 7.08 4.35 C 0.02 - C<br />
General governments 0.06 0.55 C C 124.18 16.28 6.82 0.82 - 13.04<br />
Credit institutions 0.27 C 25.23 1.22 145.70 18.11 6.37 0.69 - C<br />
Other financial corporations C 0.01 4.58 0.14 146.71 10.75 C 0.18 - C<br />
Non-financial corporations C 5.92 8.73 4.01 546.14 148.25 61.94 4.27 - 72.01<br />
Households C 6.47 19.45 4.21 718.70 114.69 84.92 5.09 - 100.61<br />
Debt securities 2.68 C 34.32 5.89 229.22 85.04 47.54 6.02 - 58.72<br />
of which: loans and receivables 0.00 0.00 0.71 0.00 14.09 2.71 8.48 C - C<br />
of which: held to maturity 1) C 0.00 C C 10.31 31.44 0.69 0.69 - 1.37<br />
of which: available for sale C C 27.82 2.24 180.53 34.78 30.49 4.64 - 28.61<br />
of which: designated at fair value through profit or loss 2) C 0.62 0.54 C 3.98 C C C - C<br />
of which: held for trading 3) C 0.20 C 0.00 19.07 5.90 7.73 C - C<br />
Equity instruments C 0.01 C C 18.93 3.48 8.53 0.18 - 1.53<br />
of which: available for sale 0.01 0.01 C 0.00 5.34 2.95 7.73 0.15 - C<br />
of which: designated at fair value through profit or loss 2) C C C C 1.21 0.26 C 0.02 - C<br />
of which: held for trading 3) C 0.00 C 0.00 C 0.26 0.19 0.00 - C<br />
Derivatives C 0.12 1.06 0.02 142.69 18.31 4.00 0.02 - C<br />
Trading C 0.12 0.91 0.02 105.84 13.33 3.83 0.02 - C<br />
Derivatives – hedge accounting 0.00 0.00 0.15 0.00 36.84 4.98 0.17 0.00 - 5.48<br />
Investments in subsidiaries, joint-ventures and associates C C C 0.13 5.53 7.26 2.13 C - C<br />
Intangible assets and goodwill 0.02 0.01 0.45 0.02 3.03 2.52 0.41 C - C<br />
Other assets 4) 0.17 0.23 2.44 0.38 84.76 14.99 19.34 0.60 - C<br />
Total assets 12.87 18.29 116.68 18.76 2,333.20 491.39 254.53 20.35 - 482.46<br />
Source: ECB.<br />
Notes: Significant institutions at the highest level of consolidation for which common reporting (COREP) and financial reporting (FINREP) are available.<br />
C: the value is suppressed for confidentiality reasons.<br />
1) This item includes non-trading debt instruments measured using the cost-based method for national accounting standards (nGAAP) reporters.<br />
2) This item includes non-trading non-derivative financial assets measured at fair value through profit or loss for nGAAP reporters.<br />
3) Includes nGAAP trading portfolios.<br />
4) Computed as the difference between "total assets" and the sum of the other sub-categories.<br />
5) There are no significant institutions at the highest level of consolidation in Slovakia.<br />
<strong>Supervisory</strong> <strong>Banking</strong> <strong>Statistics</strong>, Third quarter 2016 29