Supervisory Banking Statistics
supervisorybankingstatistics_third_quarter_2016_201701.en
supervisorybankingstatistics_third_quarter_2016_201701.en

You also want an ePaper? Increase the reach of your titles
YUMPU automatically turns print PDFs into web optimized ePapers that Google loves.
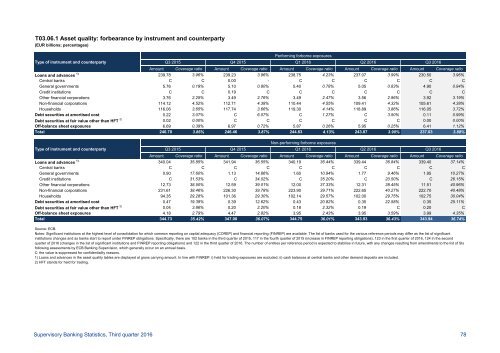
T03.06.1 Asset quality: forbearance by instrument and counterparty<br />
(EUR billions; percentages)<br />
Type of instrument and counterparty<br />
Amount Coverage ratio Amount Coverage ratio Amount Coverage ratio Amount Coverage ratio Amount Coverage ratio<br />
Loans and advances 1) 239.78 3.96% 239.23 3.96% 238.75 4.23% 237.07 3.99% 230.50 3.96%<br />
Central banks C C 0.00 - C C C C C C<br />
General governments 5.76 0.19% 5.10 0.80% 5.40 0.78% 5.05 0.83% 4.90 0.94%<br />
Credit institutions C C 0.19 C C C C C C C<br />
Other financial corporations 3.76 2.25% 3.49 2.76% 3.49 2.47% 3.56 2.96% 3.92 3.19%<br />
Non-financial corporations 114.12 4.52% 112.71 4.38% 110.44 4.55% 109.41 4.32% 105.61 4.38%<br />
Households 116.06 3.65% 117.74 3.66% 119.30 4.14% 118.89 3.86% 116.05 3.72%<br />
Debt securities at amortised cost 0.22 3.07% C 6.07% C 1.27% C 3.50% 0.11 0.99%<br />
Debt securities at fair value other than HFT 2) 0.02 0.00% C C C C C C 0.00 0.00%<br />
Off-balance sheet exposures 6.69 0.39% 6.97 0.72% 5.87 0.26% 5.95 0.25% 6.41 1.12%<br />
Total 246.70 3.86% 246.46 3.87% 244.83 4.13% 243.07 3.90% 237.03 3.88%<br />
Type of instrument and counterparty<br />
Performing forborne exposures<br />
Q3 2015 Q4 2015 Q1 2016 Q2 2016 Q3 2016<br />
Non-performing forborne exposures<br />
Q3 2015 Q4 2015 Q1 2016 Q2 2016 Q3 2016<br />
Amount Coverage ratio Amount Coverage ratio Amount Coverage ratio Amount Coverage ratio Amount Coverage ratio<br />
Loans and advances 1) 340.04 35.85% 341.94 36.55% 340.19 36.44% 339.44 36.84% 339.40 37.14%<br />
Central banks C C C C C C C C C C<br />
General governments 0.90 17.60% 1.13 14.86% 1.60 10.94% 1.77 9.46% 1.95 10.27%<br />
Credit institutions C 31.53% C 34.02% C 35.20% C 20.50% C 26.15%<br />
Other financial corporations 12.73 38.50% 12.59 39.01% 12.00 37.33% 12.31 38.45% 11.51 40.96%<br />
Non-financial corporations 231.61 38.46% 226.30 39.78% 223.90 39.71% 222.65 40.27% 222.70 40.48%<br />
Households 94.35 29.28% 101.36 29.30% 102.14 29.57% 102.00 29.75% 102.75 30.04%<br />
Debt securities at amortised cost 0.47 19.39% 0.39 12.62% 0.43 20.82% 0.35 22.58% 0.35 25.11%<br />
Debt securities at fair value other than HFT 2) 0.04 3.86% 0.20 2.20% 0.18 2.32% 0.19 C 0.20 C<br />
Off-balance sheet exposures 4.18 2.79% 4.47 2.82% 3.95 2.43% 3.95 3.59% 3.99 4.35%<br />
Total 344.73 35.42% 347.00 36.07% 344.75 36.01% 343.93 36.43% 343.94 36.74%<br />
Source: ECB.<br />
Notes: Significant institutions at the highest level of consolidation for which common reporting on capital adequacy (COREP) and financial reporting (FINREP) are available. The list of banks used for the various reference periods may differ as the list of significant<br />
institutions changes and as banks start to report under FINREP obligations. Specifically, there are 102 banks in the third quarter of 2015, 117 in the fourth quarter of 2015 (increase in FINREP reporting obligations), 123 in the first quarter of 2016, 124 in the second<br />
quarter of 2016 (changes in the list of significant institutions and FINREP reporting obligations) and 122 in the third quarter of 2016. The number of entities per reference period is expected to stabilise in future, with any changes resulting from amendments to the list of SIs<br />
following assessments by ECB <strong>Banking</strong> Supervision, which generally occur on an annual basis.<br />
C: the value is suppressed for confidentiality reasons.<br />
1) Loans and advances in the asset quality tables are displayed at gross carrying amount. In line with FINREP: i) held for trading exposures are excluded, ii) cash balances at central banks and other demand deposits are included.<br />
2) HFT stands for held for trading.<br />
<strong>Supervisory</strong> <strong>Banking</strong> <strong>Statistics</strong>, Third quarter 2016 78