Supervisory Banking Statistics
supervisorybankingstatistics_third_quarter_2016_201701.en
supervisorybankingstatistics_third_quarter_2016_201701.en

You also want an ePaper? Increase the reach of your titles
YUMPU automatically turns print PDFs into web optimized ePapers that Google loves.
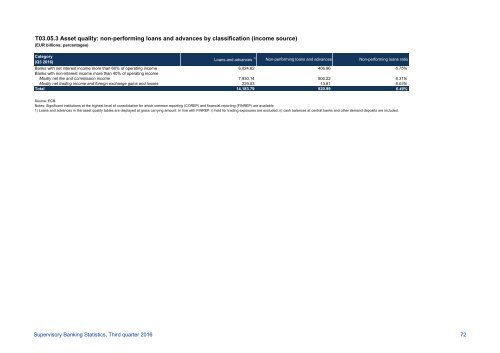
T03.05.3 Asset quality: non‐performing loans and advances by classification (income source)<br />
(EUR billions; percentages)<br />
Category<br />
(Q3 2016)<br />
Loans and advances 1) Non-performing loans and advances Non-performing loans ratio<br />
Banks with net interest income more than 60% of operating income 6,024.62 406.96 6.75%<br />
Banks with non-interest income more than 40% of operating income<br />
Mostly net fee and commission income 7,930.14 500.22 6.31%<br />
Mostly net trading income and foreign exchange gains and losses 229.03 13.81 6.03%<br />
Total 14,183.79 920.99 6.49%<br />
Source: ECB.<br />
Notes: Significant institutions at the highest level of consolidation for which common reporting (COREP) and financial reporting (FINREP) are available.<br />
1) Loans and advances in the asset quality tables are displayed at gross carrying amount. In line with FINREP: i) held for trading exposures are excluded, ii) cash balances at central banks and other demand deposits are included.<br />
<strong>Supervisory</strong> <strong>Banking</strong> <strong>Statistics</strong>, Third quarter 2016 72