Supervisory Banking Statistics
supervisorybankingstatistics_third_quarter_2016_201701.en
supervisorybankingstatistics_third_quarter_2016_201701.en

You also want an ePaper? Increase the reach of your titles
YUMPU automatically turns print PDFs into web optimized ePapers that Google loves.
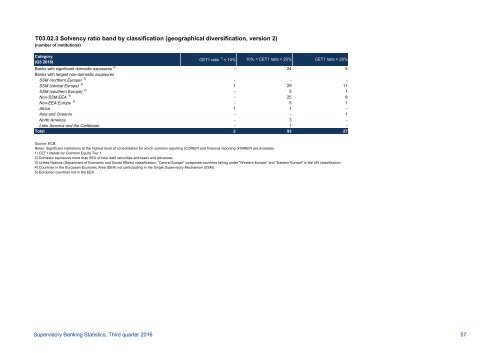
T03.02.3 Solvency ratio band by classification (geographical diversification, version 2)<br />
(number of institutions)<br />
Category<br />
(Q3 2016)<br />
CET1 ratio 1) < 10% 10% < CET1 ratio < 20% CET1 ratio > 20%<br />
Banks with significant domestic exposures 2) - 24 5<br />
Banks with largest non-domestic exposures<br />
SSM (northern Europe) 3) - - -<br />
SSM (central Europe) 3) 1 29 11<br />
SSM (southern Europe) 3) - 5 1<br />
Non-SSM EEA 4) - 25 8<br />
Non-EEA Europe 5) - 5 1<br />
Africa 1 1 -<br />
Asia and Oceania - - 1<br />
North America - 3 -<br />
Latin America and the Caribbean - 1 -<br />
Total 2 93 27<br />
Source: ECB.<br />
Notes: Significant institutions at the highest level of consolidation for which common reporting (COREP) and financial reporting (FINREP) are available.<br />
1) CET1 stands for Common Equity Tier 1.<br />
2) Domestic exposures more than 95% of total debt securities and loans and advances.<br />
3) United Nations (Department of Economic and Social Affairs) classification. "Central Europe" comprises countries falling under "Western Europe" and "Eastern Europe" in the UN classification.<br />
4) Countries in the European Economic Area (EEA) not participating in the Single <strong>Supervisory</strong> Mechanism (SSM).<br />
5) European countries not in the EEA.<br />
<strong>Supervisory</strong> <strong>Banking</strong> <strong>Statistics</strong>, Third quarter 2016 57